229 Elm St Findlay, OH 45840
Estimated Value: $115,000 - $194,000
3
Beds
1
Bath
1,422
Sq Ft
$118/Sq Ft
Est. Value
About This Home
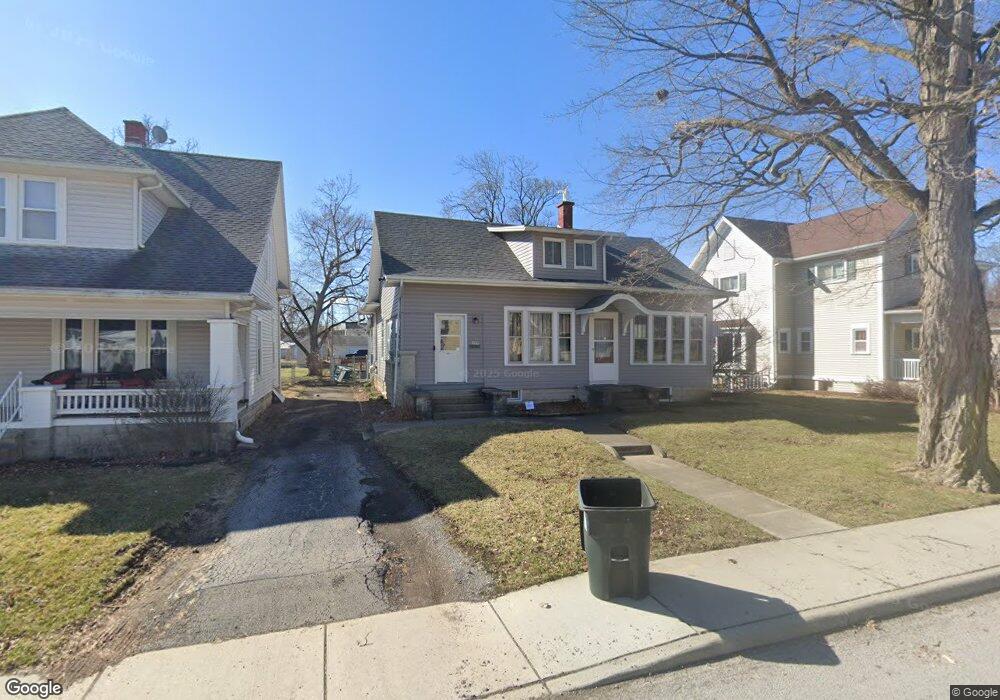
This home is located at 229 Elm St, Findlay, OH 45840 and is currently estimated at $168,379, approximately $118 per square foot. 229 Elm St is a home located in Hancock County with nearby schools including Lincoln Elementary School, Donnell Middle School, and Findlay High School.
Ownership History
Date
Name
Owned For
Owner Type
Purchase Details
Closed on
Apr 30, 2018
Sold by
Hicks John B and Hicks Laurie T
Bought by
Winans Robert S
Current Estimated Value
Home Financials for this Owner
Home Financials are based on the most recent Mortgage that was taken out on this home.
Original Mortgage
$116,875
Outstanding Balance
$100,726
Interest Rate
4.44%
Mortgage Type
New Conventional
Estimated Equity
$67,653
Purchase Details
Closed on
Aug 11, 2000
Sold by
Grubb Nancy
Bought by
Kremer Brian T and Kremer Sonja M
Home Financials for this Owner
Home Financials are based on the most recent Mortgage that was taken out on this home.
Original Mortgage
$77,175
Interest Rate
8.24%
Mortgage Type
New Conventional
Create a Home Valuation Report for This Property
The Home Valuation Report is an in-depth analysis detailing your home's value as well as a comparison with similar homes in the area
Home Values in the Area
Average Home Value in this Area
Purchase History
| Date | Buyer | Sale Price | Title Company |
|---|---|---|---|
| Winans Robert S | $117,500 | Mid American Title Agency | |
| Kremer Brian T | $83,000 | -- |
Source: Public Records
Mortgage History
| Date | Status | Borrower | Loan Amount |
|---|---|---|---|
| Open | Winans Robert S | $116,875 | |
| Previous Owner | Kremer Brian T | $77,175 |
Source: Public Records
Tax History Compared to Growth
Tax History
| Year | Tax Paid | Tax Assessment Tax Assessment Total Assessment is a certain percentage of the fair market value that is determined by local assessors to be the total taxable value of land and additions on the property. | Land | Improvement |
|---|---|---|---|---|
| 2024 | $1,498 | $42,160 | $6,510 | $35,650 |
| 2023 | $1,500 | $42,160 | $6,510 | $35,650 |
| 2022 | $1,495 | $42,160 | $6,510 | $35,650 |
| 2021 | $1,329 | $32,660 | $6,690 | $25,970 |
| 2020 | $1,329 | $32,660 | $6,690 | $25,970 |
| 2019 | $1,302 | $32,660 | $6,690 | $25,970 |
| 2018 | $1,205 | $27,690 | $4,710 | $22,980 |
| 2017 | $602 | $27,690 | $4,710 | $22,980 |
| 2016 | $1,195 | $27,690 | $4,710 | $22,980 |
| 2015 | $1,440 | $32,940 | $4,710 | $28,230 |
| 2014 | $1,440 | $32,940 | $4,710 | $28,230 |
| 2012 | $1,291 | $29,260 | $4,710 | $24,550 |
Source: Public Records
Map
Nearby Homes