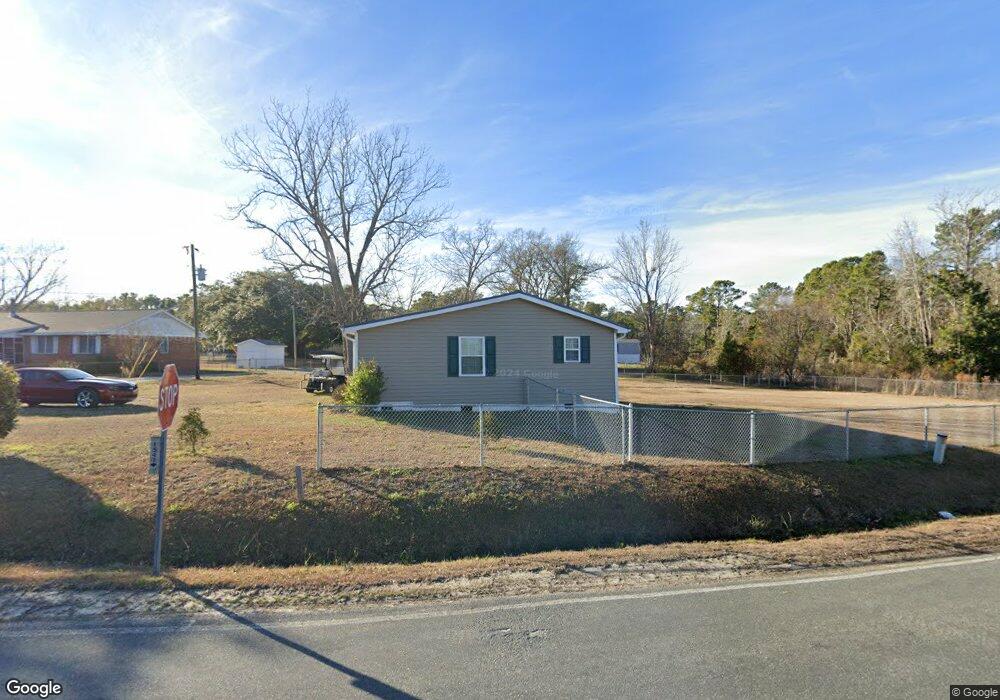
229 Fulcher Landing Rd Sneads Ferry, NC 28460
Estimated Value: $122,000
3
Beds
1
Bath
822
Sq Ft
$148/Sq Ft
Est. Value
About This Home
This home is located at 229 Fulcher Landing Rd, Sneads Ferry, NC 28460 and is currently priced at $122,000, approximately $148 per square foot. 229 Fulcher Landing Rd is a home located in Onslow County with nearby schools including Dixon Elementary School and Dixon High School.
Ownership History
Date
Name
Owned For
Owner Type
Purchase Details
Closed on
Jul 14, 2022
Sold by
Millis Anthony S
Bought by
Hall Errol D and Hall Jeannie
Current Estimated Value
Purchase Details
Closed on
Jun 15, 2022
Sold by
Millis Anthony S
Bought by
Hamilton Harold G and Hamilton Sandra P
Purchase Details
Closed on
Apr 23, 2021
Sold by
Millis Anthony S
Bought by
Asbury Ashley and Asbury Christina
Home Financials for this Owner
Home Financials are based on the most recent Mortgage that was taken out on this home.
Original Mortgage
$60,000
Interest Rate
3%
Mortgage Type
Commercial
Purchase Details
Closed on
Dec 20, 2019
Sold by
Moore Whitney Lynette and Moore Desiare
Bought by
Millis Anthony S
Purchase Details
Closed on
Aug 8, 2019
Sold by
Everett Frederick M and Everett Carolyn
Bought by
Millis Anthony S
Purchase Details
Closed on
Nov 26, 2001
Bought by
Everett Frederick M and Everett Others
Create a Home Valuation Report for This Property
The Home Valuation Report is an in-depth analysis detailing your home's value as well as a comparison with similar homes in the area
Home Values in the Area
Average Home Value in this Area
Purchase History
| Date | Buyer | Sale Price | Title Company |
|---|---|---|---|
| Hall Errol D | $36,500 | Robinson Gordon E | |
| Hamilton Harold G | $42,000 | Hardin & Chaban Pc | |
| Asbury Ashley | $61,000 | None Available | |
| Millis Anthony S | -- | None Available | |
| Millis Anthony S | $105,000 | None Available | |
| Everett Frederick M | -- | -- |
Source: Public Records
Mortgage History
| Date | Status | Borrower | Loan Amount |
|---|---|---|---|
| Previous Owner | Asbury Ashley | $60,000 |
Source: Public Records
Tax History Compared to Growth
Tax History
| Year | Tax Paid | Tax Assessment Tax Assessment Total Assessment is a certain percentage of the fair market value that is determined by local assessors to be the total taxable value of land and additions on the property. | Land | Improvement |
|---|---|---|---|---|
| 2022 | $164 | $25,000 | $25,000 | $0 |
| 2021 | $342 | $48,500 | $48,000 | $500 |
| 2020 | $342 | $48,500 | $48,000 | $500 |
| 2019 | $342 | $48,500 | $48,000 | $500 |
| 2018 | $562 | $79,730 | $48,000 | $31,730 |
| 2017 | $579 | $85,790 | $50,000 | $35,790 |
| 2016 | $579 | $85,790 | $0 | $0 |
| 2015 | $579 | $85,790 | $0 | $0 |
| 2014 | $579 | $85,790 | $0 | $0 |
Source: Public Records
Map
Nearby Homes
- 228 Fulcher Landing Rd
- 226 Fulcher Landing Rd
- 232 Fulcher Landing Rd
- 208 Fulcher Landing Rd
- 112 Midland Ln
- 141 Lawndale Ln
- 139 Hall Point
- 153 Lawndale Ln
- 506 Transom Way
- 119 Lawndale Ln
- 179 Hall Point Rd
- 104 Justice Farm Dr
- 102 Justice Farm Dr
- 535 Moore Landing Rd
- 159 Tillett Ln
- 211 Fannie Creek Ln
- 211 Riverside Dr
- 221 Riverside Dr
- 657 Canady Rd
- 250 Riverside Dr
- 225 Fulcher Landing Rd
- 408 Sam Millis Dr
- 509 Scallop Shells Ln
- 221 Fulcher Landing Rd
- 234 Fulcher Landing Rd
- 222 Fulcher Landing Rd
- 243 Fulcher Landing Rd
- 230 Fulcher Landing Rd
- 240 Fulcher Landing Rd
- 412 John Everett Dr
- 215 Fulcher Landing Rd
- 216 Fulcher Landing Rd
- 246 Fulcher Landing Rd
- 420 John Everett Dr
- 251 Fulcher Landing Rd
- 210 Fulcher Landing Rd
- 207 Fulcher Landing Rd
- 206 Fulcher Landing Rd
- 2.2 Ac John Everett Dr
- 0 John Everett Dr