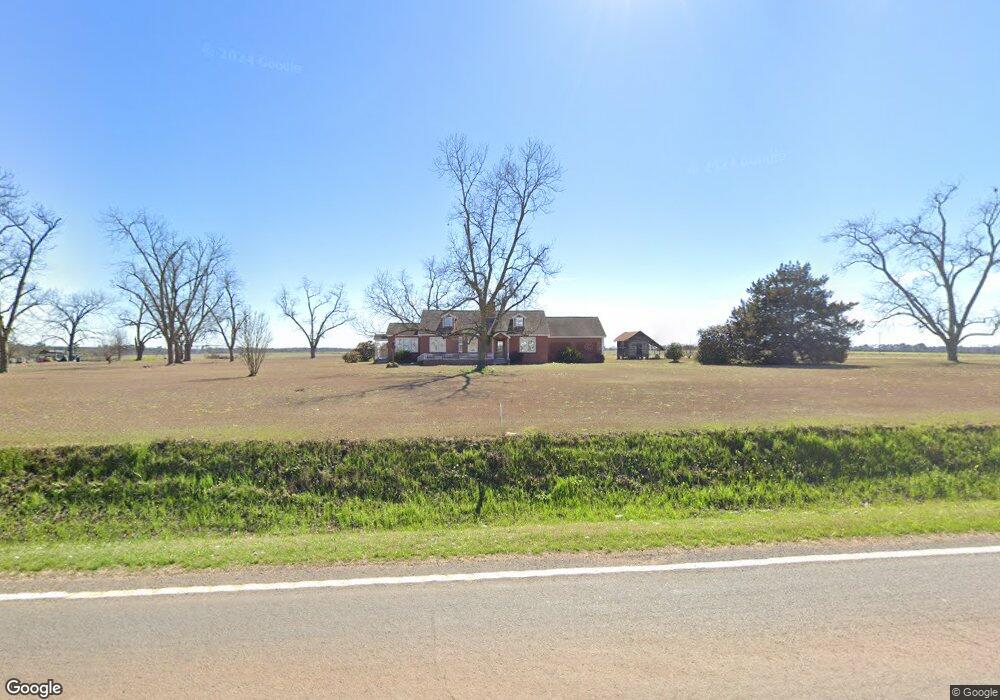
229 Ga Highway 270 W Doerun, GA 31744
Estimated Value: $74,000 - $353,000
--
Bed
2
Baths
2,660
Sq Ft
$87/Sq Ft
Est. Value
About This Home
This home is located at 229 Ga Highway 270 W, Doerun, GA 31744 and is currently estimated at $231,745, approximately $87 per square foot. 229 Ga Highway 270 W is a home located in Colquitt County with nearby schools including Doerun Elementary School, C.A. Gray Junior High School, and Willie J. Williams Middle School.
Ownership History
Date
Name
Owned For
Owner Type
Purchase Details
Closed on
Jun 6, 2024
Sold by
Jerge Norma Sue
Bought by
Phillips Robert Stephen Henry
Current Estimated Value
Home Financials for this Owner
Home Financials are based on the most recent Mortgage that was taken out on this home.
Original Mortgage
$139,094
Interest Rate
7.09%
Mortgage Type
New Conventional
Purchase Details
Closed on
Dec 16, 2016
Sold by
Glausier Norma Sue
Bought by
Grantham William E
Purchase Details
Closed on
Dec 19, 2001
Sold by
Culbreth Jon R
Bought by
Culbreth Jon R
Purchase Details
Closed on
May 1, 1995
Sold by
Culbreth Jan Pierce Etal
Bought by
Culbreth Farms Culbreth Farms L and Culbreth Farms P
Purchase Details
Closed on
Mar 24, 1995
Sold by
Culbreth C T
Bought by
Culbreth Jon R
Purchase Details
Closed on
Mar 3, 1975
Bought by
Culbreth C T
Create a Home Valuation Report for This Property
The Home Valuation Report is an in-depth analysis detailing your home's value as well as a comparison with similar homes in the area
Home Values in the Area
Average Home Value in this Area
Purchase History
| Date | Buyer | Sale Price | Title Company |
|---|---|---|---|
| Phillips Robert Stephen Henry | $4,000 | -- | |
| Culbreth Chrissy | -- | -- | |
| Phillips Robert Stephen Henry | -- | -- | |
| Grantham William E | $10,502 | -- | |
| Culbreth Jon R | $194,600 | -- | |
| Culbreth Farms Culbreth Farms L | $393,500 | -- | |
| Culbreth M R Etal | $98,400 | -- | |
| Culbreth Jon R | -- | -- | |
| Culbreth C T | -- | -- |
Source: Public Records
Mortgage History
| Date | Status | Borrower | Loan Amount |
|---|---|---|---|
| Previous Owner | Phillips Robert Stephen Henry | $139,094 |
Source: Public Records
Tax History Compared to Growth
Tax History
| Year | Tax Paid | Tax Assessment Tax Assessment Total Assessment is a certain percentage of the fair market value that is determined by local assessors to be the total taxable value of land and additions on the property. | Land | Improvement |
|---|---|---|---|---|
| 2024 | $1,819 | $88,254 | $7,713 | $80,541 |
| 2023 | $1,819 | $70,806 | $7,982 | $62,824 |
| 2022 | $1,467 | $63,602 | $7,095 | $56,507 |
| 2021 | $1,313 | $56,072 | $7,095 | $48,977 |
| 2020 | $1,247 | $52,457 | $7,095 | $45,362 |
| 2019 | $1,321 | $50,047 | $7,095 | $42,952 |
| 2018 | $1,314 | $51,369 | $8,417 | $42,952 |
| 2017 | $1,549 | $56,906 | $13,954 | $42,952 |
| 2016 | $1,569 | $56,906 | $13,954 | $42,952 |
| 2015 | $1,284 | $56,906 | $13,954 | $42,952 |
| 2014 | $1,260 | $46,142 | $13,954 | $32,188 |
| 2013 | -- | $46,142 | $13,954 | $32,188 |
Source: Public Records
Map
Nearby Homes
- 715 W Robinson Ave
- 511 W Broad Ave
- 417 W Bay Ave
- 825 N Green St
- 104 Union Ln
- 318 E Culpepper Ave
- 512 Hagin Still Rd
- 0 Sam Sells Rd
- 2329 Evergreen Rd
- 1791 Funston Sigsbee Rd
- 340 Belk Rd
- 712 Blackberry Rd
- 1485 Bay Rd
- 4409 Georgia 112
- 156 E Maple St
- 0 Brest Station Rd Unit 10642758
- 155 N Kreuger St
- 9765 Morey Hill Rd
- 378 Old S R 33
- 330/332 Debbie Ln
- 295 Ga Highway 270 W
- 280 Ga Highway 270 W
- 138 Ga Highway 270 W
- 122 Ga Highway 270 W
- 805 W Bay Ave
- 805 W Bay Ave Unit 2
- 812 W Bay Ave
- 823 W Robinson Ave
- 216 Ticknor Rd
- 639 W Bay Ave
- 218 Ticknor Rd
- 801 W Robinson Ave
- 723 W Robinson Ave
- 719 W Robinson Ave
- 603 W Broad Ave
- 720 W Robinson Ave
- 711 W Robinson Ave
- 714 W Robinson Ave
- 617 W Robinson Ave
- 706 W Robinson Ave