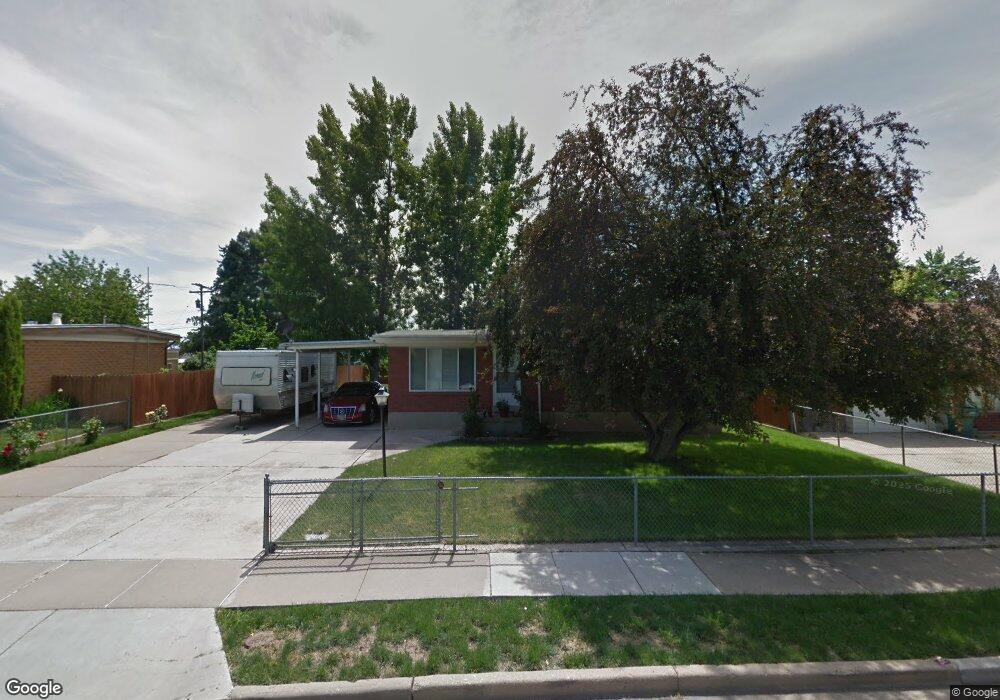
229 Hawthorne St Layton, UT 84041
Estimated Value: $428,000 - $476,000
4
Beds
2
Baths
1,099
Sq Ft
$413/Sq Ft
Est. Value
About This Home
This home is located at 229 Hawthorne St, Layton, UT 84041 and is currently estimated at $454,394, approximately $413 per square foot. 229 Hawthorne St is a home located in Davis County with nearby schools including Crestview Elementary School, Central Davis Junior High School, and Layton High School.
Ownership History
Date
Name
Owned For
Owner Type
Purchase Details
Closed on
May 12, 2025
Sold by
Miller Andrew Ira
Bought by
Miller Andrew Ira and Miller Jamle Melissa
Current Estimated Value
Home Financials for this Owner
Home Financials are based on the most recent Mortgage that was taken out on this home.
Original Mortgage
$371,200
Outstanding Balance
$368,536
Interest Rate
6.64%
Mortgage Type
New Conventional
Estimated Equity
$85,858
Purchase Details
Closed on
May 7, 2025
Sold by
Smith Raymond J and Smith Magic
Bought by
Miller Andrew Ira
Home Financials for this Owner
Home Financials are based on the most recent Mortgage that was taken out on this home.
Original Mortgage
$371,200
Outstanding Balance
$368,536
Interest Rate
6.64%
Mortgage Type
New Conventional
Estimated Equity
$85,858
Purchase Details
Closed on
Aug 18, 2010
Sold by
Bartay Verda R
Bought by
Smith Kenneth J and Smith Shirley Ann
Purchase Details
Closed on
Dec 8, 2009
Sold by
Bartay Verda R
Bought by
Bartay Verda R
Create a Home Valuation Report for This Property
The Home Valuation Report is an in-depth analysis detailing your home's value as well as a comparison with similar homes in the area
Home Values in the Area
Average Home Value in this Area
Purchase History
| Date | Buyer | Sale Price | Title Company |
|---|---|---|---|
| Miller Andrew Ira | -- | Metro National Title | |
| Miller Andrew Ira | -- | Us Title | |
| Smith Kenneth J | -- | Bonneville Superior Title Co | |
| Bartay Verda R | -- | None Available | |
| Bartay Verda R | -- | None Available | |
| Bartay Verda R | -- | None Available |
Source: Public Records
Mortgage History
| Date | Status | Borrower | Loan Amount |
|---|---|---|---|
| Open | Miller Andrew Ira | $371,200 |
Source: Public Records
Tax History
| Year | Tax Paid | Tax Assessment Tax Assessment Total Assessment is a certain percentage of the fair market value that is determined by local assessors to be the total taxable value of land and additions on the property. | Land | Improvement |
|---|---|---|---|---|
| 2025 | $1,944 | $204,050 | $113,461 | $90,589 |
| 2024 | $2,008 | $212,299 | $131,481 | $80,818 |
| 2023 | $1,872 | $191,950 | $82,373 | $109,576 |
| 2022 | $1,956 | $360,000 | $147,490 | $212,510 |
| 2021 | $1,716 | $259,000 | $119,085 | $139,915 |
| 2020 | $1,554 | $225,000 | $97,948 | $127,052 |
| 2019 | $1,537 | $218,000 | $91,020 | $126,980 |
| 2018 | $1,377 | $196,000 | $91,020 | $104,980 |
| 2016 | $1,189 | $87,340 | $30,526 | $56,814 |
| 2015 | $1,122 | $78,265 | $30,526 | $47,739 |
| 2014 | $1,031 | $73,495 | $30,526 | $42,969 |
| 2013 | -- | $69,268 | $18,612 | $50,656 |
Source: Public Records
Map
Nearby Homes
- 350 Church St
- 34 E 525 N
- 22 E 525 N
- 24 Grover St
- 149 N Fort Ln Unit 1D
- 339 W 25 N Unit 6
- 356 W 25 N
- 189 S Main St Unit 76
- 189 S Main St Unit 21
- 361 W 50 N
- 355 W Gentile St
- 88 Ellison St
- 220 W 590 N
- 418 W Gentile St
- 138 W Golden Ave
- 586 Wasatch Dr
- 753 S 300 E
- 9 Colonial Ave
- 84 E Diamond St
- 929 Amethyst St
- 221 Hawthorne Dr
- 221 Hawthorne St
- 237 Hawthorne Dr
- 209 Hawthorne Dr
- 198 Green Dr
- 247 Hawthorne St
- 209 Hawthorne St
- 186 Green Dr
- 210 Green Dr
- 176 Green Dr
- 236 Hawthorne St
- 228 Hawthorne St
- 265 Hawthorne St
- 220 Green Dr
- 199 Hawthorne St
- 216 Hawthorne St
- 244 Hawthorne St
- 164 Green Dr
- 204 Hawthorne Dr
- 204 Hawthorne St
Your Personal Tour Guide
Ask me questions while you tour the home.