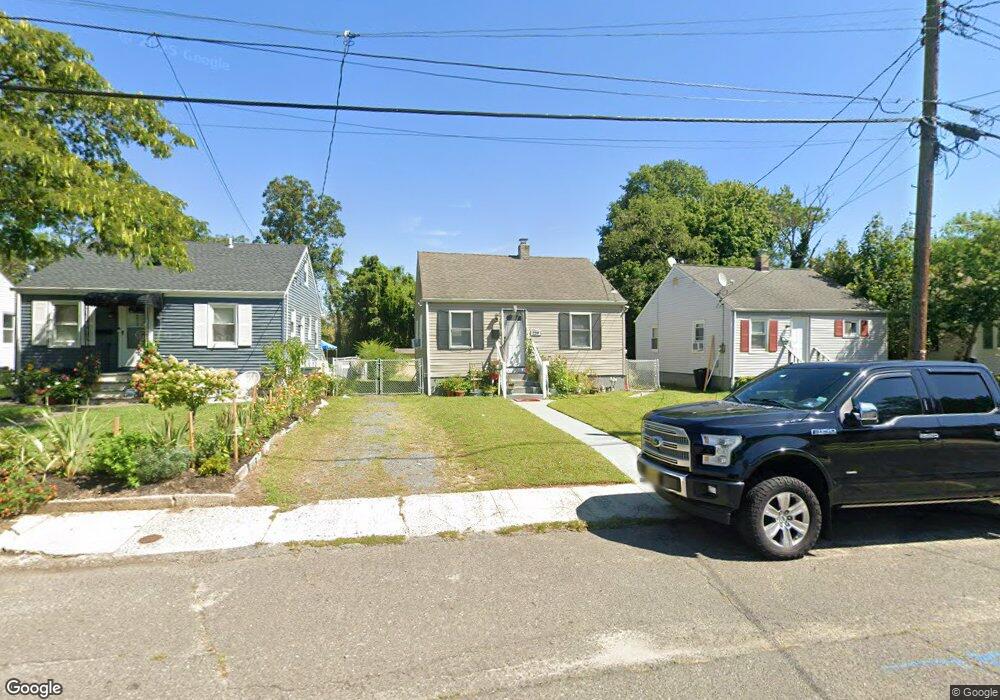
229 Ludlow St Long Branch, NJ 07740
Estimated Value: $388,000 - $484,086
2
Beds
2
Baths
624
Sq Ft
$698/Sq Ft
Est. Value
About This Home
This home is located at 229 Ludlow St, Long Branch, NJ 07740 and is currently estimated at $435,772, approximately $698 per square foot. 229 Ludlow St is a home located in Monmouth County with nearby schools including Long Branch High School and Holy Trinity School.
Ownership History
Date
Name
Owned For
Owner Type
Purchase Details
Closed on
Aug 6, 2009
Sold by
Unipro Property Group Llc
Bought by
Mixi Jean D
Current Estimated Value
Home Financials for this Owner
Home Financials are based on the most recent Mortgage that was taken out on this home.
Original Mortgage
$160,047
Outstanding Balance
$105,727
Interest Rate
5.47%
Mortgage Type
FHA
Estimated Equity
$330,045
Purchase Details
Closed on
Feb 24, 2009
Sold by
Watson Myrtle and Farmer Mary Frances
Bought by
Unipro Property Group Llc
Purchase Details
Closed on
Nov 3, 2008
Sold by
Farmer Mary Frances
Bought by
Unipro Property Group Llc
Home Financials for this Owner
Home Financials are based on the most recent Mortgage that was taken out on this home.
Original Mortgage
$64,000
Interest Rate
6.47%
Mortgage Type
Seller Take Back
Create a Home Valuation Report for This Property
The Home Valuation Report is an in-depth analysis detailing your home's value as well as a comparison with similar homes in the area
Home Values in the Area
Average Home Value in this Area
Purchase History
| Date | Buyer | Sale Price | Title Company |
|---|---|---|---|
| Mixi Jean D | $163,000 | None Available | |
| Unipro Property Group Llc | $75,000 | Prestige Title Agency Inc | |
| Unipro Property Group Llc | $65,000 | None Available |
Source: Public Records
Mortgage History
| Date | Status | Borrower | Loan Amount |
|---|---|---|---|
| Open | Mixi Jean D | $160,047 | |
| Previous Owner | Unipro Property Group Llc | $64,000 |
Source: Public Records
Tax History Compared to Growth
Tax History
| Year | Tax Paid | Tax Assessment Tax Assessment Total Assessment is a certain percentage of the fair market value that is determined by local assessors to be the total taxable value of land and additions on the property. | Land | Improvement |
|---|---|---|---|---|
| 2025 | $5,261 | $367,600 | $247,400 | $120,200 |
| 2024 | $4,614 | $342,300 | $227,400 | $114,900 |
| 2023 | $4,614 | $297,100 | $187,400 | $109,700 |
| 2022 | $3,816 | $232,000 | $135,300 | $96,700 |
| 2021 | $3,816 | $190,700 | $100,300 | $90,400 |
| 2020 | $3,703 | $177,200 | $87,300 | $89,900 |
| 2019 | $3,552 | $169,000 | $83,300 | $85,700 |
| 2018 | $3,463 | $163,800 | $81,300 | $82,500 |
| 2017 | $3,304 | $160,300 | $79,300 | $81,000 |
| 2016 | $3,420 | $169,200 | $90,300 | $78,900 |
| 2015 | $2,626 | $117,900 | $58,000 | $59,900 |
| 2014 | $2,684 | $127,000 | $73,900 | $53,100 |
Source: Public Records
Map
Nearby Homes
- 190 Spruce St Unit 4
- 222 Coleman Ave
- 401 Joline Ave
- 184 N 5th Ave
- 148 Sixth Ave
- 211 Rockwell Ave
- 151 N 5th Ave
- 565 Joline Ave
- 13 Morris Place
- 15 Signal Ave
- 572 Jay St
- 238 Branchport Ave
- 40 University Dr
- 119 Washington St
- 392 Florence Ave
- 40 N 5th Ave
- 323 Florence Ave
- 188 Chelton Ave
- 631 Irving Place
- 14 Slocum Place