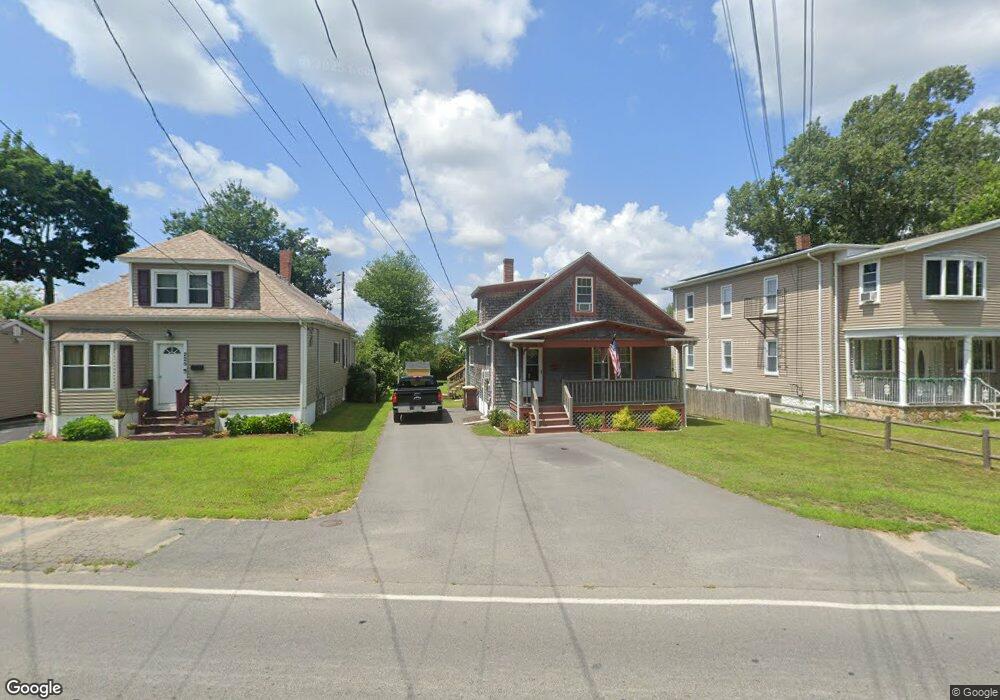
229 Main St Acushnet, MA 02743
Upper Acushnet NeighborhoodEstimated Value: $406,000 - $509,000
--
Bed
1
Bath
1,376
Sq Ft
$324/Sq Ft
Est. Value
About This Home
This home is located at 229 Main St, Acushnet, MA 02743 and is currently estimated at $446,215, approximately $324 per square foot. 229 Main St is a home located in Bristol County with nearby schools including Acushnet Elementary School, Albert F Ford Middle School, and Alma Del Mar Charter School.
Ownership History
Date
Name
Owned For
Owner Type
Purchase Details
Closed on
Jun 28, 2016
Sold by
Jorissen Elaine J
Bought by
Gonneville Elaine J and Gonneville Gerard A
Current Estimated Value
Purchase Details
Closed on
Jun 21, 1982
Bought by
Jorissen Elaine J
Create a Home Valuation Report for This Property
The Home Valuation Report is an in-depth analysis detailing your home's value as well as a comparison with similar homes in the area
Home Values in the Area
Average Home Value in this Area
Purchase History
| Date | Buyer | Sale Price | Title Company |
|---|---|---|---|
| Gonneville Elaine J | -- | -- | |
| Jorissen Elaine J | -- | -- |
Source: Public Records
Mortgage History
| Date | Status | Borrower | Loan Amount |
|---|---|---|---|
| Previous Owner | Jorissen Elaine J | $40,000 | |
| Previous Owner | Jorissen Elaine J | $75,000 | |
| Previous Owner | Jorissen Elaine J | $38,000 | |
| Previous Owner | Jorissen Elaine J | $22,000 |
Source: Public Records
Tax History Compared to Growth
Tax History
| Year | Tax Paid | Tax Assessment Tax Assessment Total Assessment is a certain percentage of the fair market value that is determined by local assessors to be the total taxable value of land and additions on the property. | Land | Improvement |
|---|---|---|---|---|
| 2025 | $40 | $372,600 | $128,600 | $244,000 |
| 2024 | $3,839 | $336,500 | $121,900 | $214,600 |
| 2023 | $3,630 | $302,500 | $110,600 | $191,900 |
| 2022 | $3,562 | $268,400 | $103,800 | $164,600 |
| 2021 | $2,827 | $244,100 | $103,800 | $140,300 |
| 2020 | $3,654 | $237,300 | $97,000 | $140,300 |
| 2019 | $3,057 | $215,600 | $92,500 | $123,100 |
| 2018 | $57 | $215,600 | $92,500 | $123,100 |
| 2017 | $2,936 | $203,300 | $92,500 | $110,800 |
| 2016 | $2,954 | $203,300 | $92,500 | $110,800 |
| 2015 | $2,800 | $196,100 | $92,500 | $103,600 |
Source: Public Records
Map
Nearby Homes