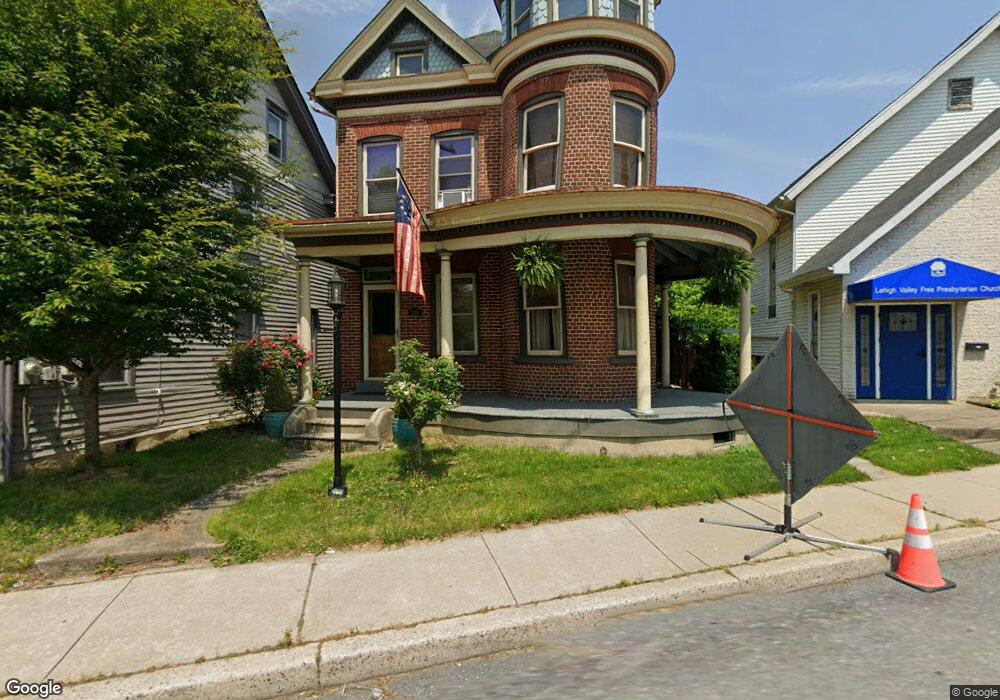
229 Main St Walnutport, PA 18088
Estimated Value: $251,000 - $272,000
3
Beds
1
Bath
1,657
Sq Ft
$156/Sq Ft
Est. Value
About This Home
This home is located at 229 Main St, Walnutport, PA 18088 and is currently estimated at $259,232, approximately $156 per square foot. 229 Main St is a home located in Northampton County with nearby schools including Slatington Elementary School, Peters Elementary School, and Northern Lehigh Middle School.
Ownership History
Date
Name
Owned For
Owner Type
Purchase Details
Closed on
Feb 27, 2006
Sold by
Thomas David J
Bought by
Harvey Natalie M
Current Estimated Value
Home Financials for this Owner
Home Financials are based on the most recent Mortgage that was taken out on this home.
Original Mortgage
$111,200
Outstanding Balance
$60,646
Interest Rate
6.16%
Mortgage Type
New Conventional
Estimated Equity
$198,586
Purchase Details
Closed on
Oct 1, 1996
Bought by
Thomas David J and Thomas Barbara A
Create a Home Valuation Report for This Property
The Home Valuation Report is an in-depth analysis detailing your home's value as well as a comparison with similar homes in the area
Home Values in the Area
Average Home Value in this Area
Purchase History
| Date | Buyer | Sale Price | Title Company |
|---|---|---|---|
| Harvey Natalie M | $139,000 | -- | |
| Thomas David J | -- | -- |
Source: Public Records
Mortgage History
| Date | Status | Borrower | Loan Amount |
|---|---|---|---|
| Open | Harvey Natalie M | $111,200 |
Source: Public Records
Tax History
| Year | Tax Paid | Tax Assessment Tax Assessment Total Assessment is a certain percentage of the fair market value that is determined by local assessors to be the total taxable value of land and additions on the property. | Land | Improvement |
|---|---|---|---|---|
| 2026 | $447 | $41,400 | $13,200 | $28,200 |
| 2025 | $447 | $41,400 | $13,200 | $28,200 |
| 2024 | $4,258 | $41,400 | $13,200 | $28,200 |
| 2023 | $4,092 | $41,400 | $13,200 | $28,200 |
| 2022 | $4,002 | $41,400 | $13,200 | $28,200 |
| 2021 | $3,997 | $41,400 | $13,200 | $28,200 |
| 2020 | $4,018 | $41,400 | $13,200 | $28,200 |
| 2019 | $3,911 | $41,400 | $13,200 | $28,200 |
| 2018 | $3,824 | $41,400 | $13,200 | $28,200 |
| 2017 | $3,878 | $41,400 | $13,200 | $28,200 |
| 2016 | -- | $41,400 | $13,200 | $28,200 |
| 2015 | -- | $41,400 | $13,200 | $28,200 |
| 2014 | -- | $41,400 | $13,200 | $28,200 |
Source: Public Records
Map
Nearby Homes
Your Personal Tour Guide
Ask me questions while you tour the home.