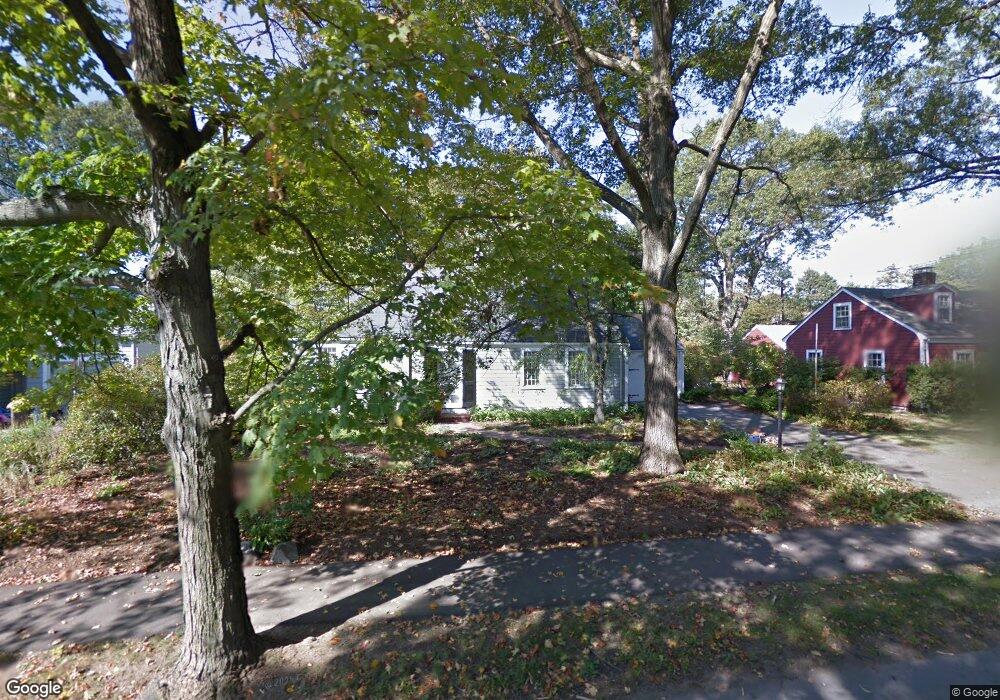
229 Manning St Needham, MA 02492
Estimated Value: $2,599,000 - $3,250,000
5
Beds
6
Baths
1,876
Sq Ft
$1,496/Sq Ft
Est. Value
About This Home
This home is located at 229 Manning St, Needham, MA 02492 and is currently estimated at $2,807,416, approximately $1,496 per square foot. 229 Manning St is a home located in Norfolk County with nearby schools including Mitchell Elementary School, High Rock Middle School, and Pollard Middle School.
Ownership History
Date
Name
Owned For
Owner Type
Purchase Details
Closed on
Jun 10, 2020
Sold by
Taylor Scott M and Taylor Sara R
Bought by
Scott M Taylor Ret 2020 and Taylor
Current Estimated Value
Purchase Details
Closed on
Nov 10, 2016
Sold by
Tower Hill Builders In
Bought by
Taylor Scott M and Taylor Sara R
Home Financials for this Owner
Home Financials are based on the most recent Mortgage that was taken out on this home.
Original Mortgage
$1,328,564
Interest Rate
3%
Mortgage Type
Purchase Money Mortgage
Purchase Details
Closed on
Dec 30, 2015
Sold by
Green Ft and Green
Bought by
Green Beulah R
Purchase Details
Closed on
Apr 29, 2010
Sold by
Green Beulah R
Bought by
Green Ft and Green
Create a Home Valuation Report for This Property
The Home Valuation Report is an in-depth analysis detailing your home's value as well as a comparison with similar homes in the area
Home Values in the Area
Average Home Value in this Area
Purchase History
| Date | Buyer | Sale Price | Title Company |
|---|---|---|---|
| Scott M Taylor Ret 2020 | -- | None Available | |
| Scott M Taylor Ret 2020 | -- | None Available | |
| Taylor Scott M | $1,660,706 | -- | |
| Green Beulah R | $675,000 | -- | |
| Green Beulah R | $675,000 | -- | |
| Green Ft | -- | -- | |
| Green Ft | -- | -- |
Source: Public Records
Mortgage History
| Date | Status | Borrower | Loan Amount |
|---|---|---|---|
| Previous Owner | Taylor Scott M | $1,328,564 |
Source: Public Records
Tax History
| Year | Tax Paid | Tax Assessment Tax Assessment Total Assessment is a certain percentage of the fair market value that is determined by local assessors to be the total taxable value of land and additions on the property. | Land | Improvement |
|---|---|---|---|---|
| 2025 | $25,071 | $2,365,200 | $800,800 | $1,564,400 |
| 2024 | $26,042 | $2,080,000 | $581,600 | $1,498,400 |
| 2023 | $25,586 | $1,962,100 | $581,600 | $1,380,500 |
| 2022 | $24,578 | $1,838,300 | $538,600 | $1,299,700 |
| 2021 | $23,953 | $1,838,300 | $538,600 | $1,299,700 |
| 2020 | $23,562 | $1,886,500 | $538,600 | $1,347,900 |
| 2019 | $21,146 | $1,706,700 | $489,700 | $1,217,000 |
| 2018 | $20,276 | $1,706,700 | $489,700 | $1,217,000 |
| 2017 | $10,997 | $924,900 | $489,700 | $435,200 |
| 2016 | $7,575 | $656,400 | $489,700 | $166,700 |
| 2015 | $7,411 | $656,400 | $489,700 | $166,700 |
| 2014 | $6,836 | $587,300 | $425,900 | $161,400 |
Source: Public Records
Map
Nearby Homes
- 638 Webster St
- 638 Webster St Unit 638
- 190 Brookline St
- 36 Otis St Unit 36
- 510 Webster St
- 19 Oakland Ave Unit 19
- 19 Highland Ct Unit 19
- 17 Lindbergh Ave
- 58 Morton St
- 176 Highgate St
- 7 West St
- 68 Brookline St
- 40 High St
- 193 Garden St
- 100 Bradford St
- 447 Hillside Ave
- 100 Rosemary Way Unit 129
- 31 Birds Hill Ave
- 385 Hillside Ave
- 385 Hillside Ave Unit 385
- 233 Manning St
- 223 Manning St
- 223 Manning St Unit 223
- 334 Brookline St
- 239 Manning St
- 15 Holland Terrace
- 228 Manning St
- 21 Holland Terrace
- 222 Manning St
- 338 Brookline St
- 338 Brookline St
- 338 Brookline St Unit 1
- 338 Brookline St
- 232 Manning St
- 325 Brookline St
- 321 Brookline St
- 247 Manning St
- 236 Manning St
- 331 Brookline St
- 335 Brookline St
Your Personal Tour Guide
Ask me questions while you tour the home.