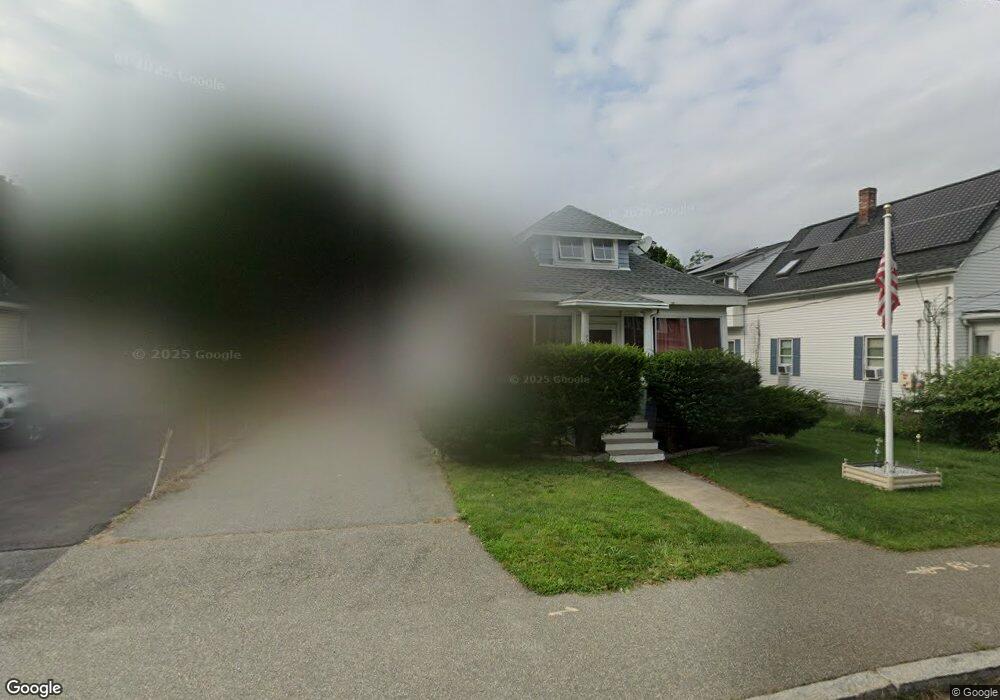
229 Market St Brockton, MA 02301
Clifton Heights NeighborhoodEstimated Value: $417,000 - $468,536
3
Beds
2
Baths
1,259
Sq Ft
$358/Sq Ft
Est. Value
About This Home
This home is located at 229 Market St, Brockton, MA 02301 and is currently estimated at $450,134, approximately $357 per square foot. 229 Market St is a home located in Plymouth County with nearby schools including John F. Kennedy Elementary School, Davis K-8 School, and South Middle School.
Ownership History
Date
Name
Owned For
Owner Type
Purchase Details
Closed on
Nov 20, 2009
Sold by
Smith Francis G and Mclaughlin Elizabeth A
Bought by
Smith Francis G
Current Estimated Value
Purchase Details
Closed on
Jun 29, 1999
Sold by
Smith Kathryn J and Quinn Adrienne E
Bought by
Smith Francis G and Mclaughlin Elizabeth A
Purchase Details
Closed on
Apr 27, 1989
Sold by
Robarts Peter C
Bought by
Smith Kathryn J
Create a Home Valuation Report for This Property
The Home Valuation Report is an in-depth analysis detailing your home's value as well as a comparison with similar homes in the area
Home Values in the Area
Average Home Value in this Area
Purchase History
| Date | Buyer | Sale Price | Title Company |
|---|---|---|---|
| Smith Francis G | -- | -- | |
| Smith Francis G | $105,000 | -- | |
| Smith Kathryn J | $124,000 | -- |
Source: Public Records
Mortgage History
| Date | Status | Borrower | Loan Amount |
|---|---|---|---|
| Previous Owner | Smith Kathryn J | $72,000 | |
| Previous Owner | Smith Kathryn J | $144,500 | |
| Previous Owner | Smith Kathryn J | $131,250 |
Source: Public Records
Tax History Compared to Growth
Tax History
| Year | Tax Paid | Tax Assessment Tax Assessment Total Assessment is a certain percentage of the fair market value that is determined by local assessors to be the total taxable value of land and additions on the property. | Land | Improvement |
|---|---|---|---|---|
| 2025 | $4,404 | $363,700 | $140,400 | $223,300 |
| 2024 | $4,110 | $341,900 | $140,400 | $201,500 |
| 2023 | $3,830 | $295,100 | $105,700 | $189,400 |
| 2022 | $4,074 | $291,600 | $96,100 | $195,500 |
| 2021 | $3,537 | $243,900 | $80,100 | $163,800 |
| 2020 | $3,478 | $229,600 | $74,800 | $154,800 |
| 2019 | $3,391 | $218,200 | $72,800 | $145,400 |
| 2018 | $2,135 | $192,600 | $72,800 | $119,800 |
| 2017 | $3,135 | $194,700 | $72,800 | $121,900 |
| 2016 | $2,331 | $134,300 | $70,700 | $63,600 |
| 2015 | $2,056 | $113,300 | $70,700 | $42,600 |
| 2014 | $2,257 | $124,500 | $70,700 | $53,800 |
Source: Public Records
Map
Nearby Homes
- 237 Market St
- 225 Market St
- 241 Market St
- 219 Market St
- 236 Market St
- 236 Market St Unit 1
- 236 Market St Unit 2
- 236 Market St Unit 3
- 245 Market St
- 215 Market St
- 230 Market St
- 238 Market St
- 238 Market St Unit 1
- 240 W Chestnut St
- 244 W Chestnut St
- 222 Market St
- 244 Market St
- 247 Market St
- 211 Market St
- 218 Market St