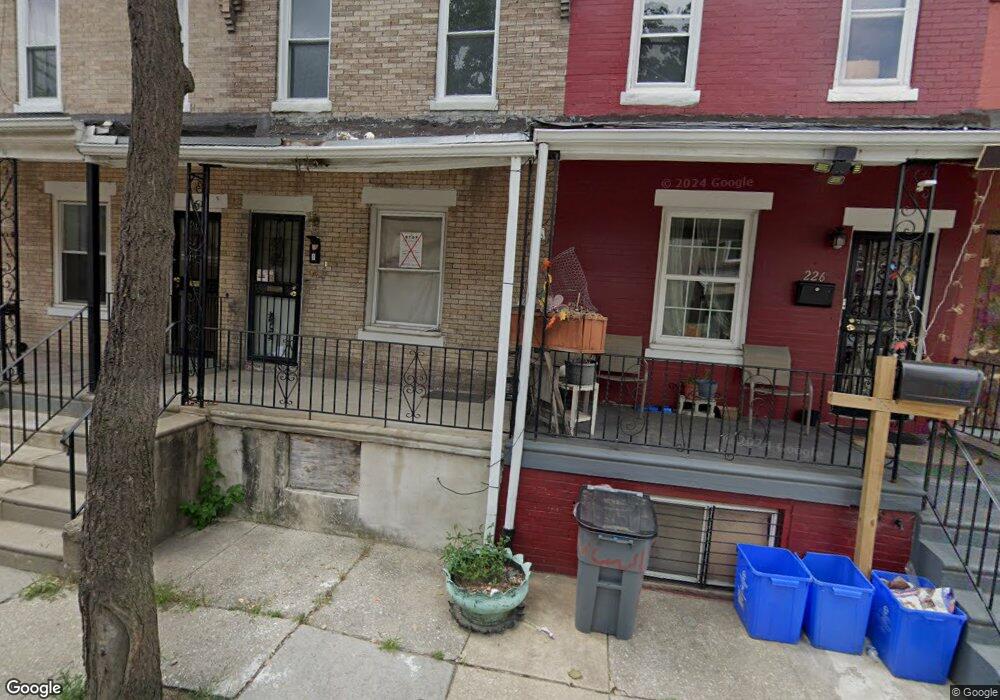
229 N Cecil St Philadelphia, PA 19139
Haddington NeighborhoodEstimated Value: $177,000 - $196,000
3
Beds
2
Baths
1,272
Sq Ft
$147/Sq Ft
Est. Value
About This Home
This home is located at 229 N Cecil St, Philadelphia, PA 19139 and is currently estimated at $186,500, approximately $146 per square foot. 229 N Cecil St is a home located in Philadelphia County with nearby schools including John Barry Elementary School, William L. Sayre High School, and Universal Bluford Charter School.
Ownership History
Date
Name
Owned For
Owner Type
Purchase Details
Closed on
Sep 21, 2022
Sold by
James Scherrie
Bought by
Phoenix Prime Llc
Current Estimated Value
Home Financials for this Owner
Home Financials are based on the most recent Mortgage that was taken out on this home.
Original Mortgage
$149,500
Outstanding Balance
$143,166
Interest Rate
5.55%
Mortgage Type
New Conventional
Estimated Equity
$43,334
Purchase Details
Closed on
Feb 2, 1956
Bought by
Arthur J Henderson
Create a Home Valuation Report for This Property
The Home Valuation Report is an in-depth analysis detailing your home's value as well as a comparison with similar homes in the area
Home Values in the Area
Average Home Value in this Area
Purchase History
| Date | Buyer | Sale Price | Title Company |
|---|---|---|---|
| Phoenix Prime Llc | $40,000 | Choice One Abstract | |
| Arthur J Henderson | -- | -- |
Source: Public Records
Mortgage History
| Date | Status | Borrower | Loan Amount |
|---|---|---|---|
| Open | Phoenix Prime Llc | $149,500 |
Source: Public Records
Tax History Compared to Growth
Tax History
| Year | Tax Paid | Tax Assessment Tax Assessment Total Assessment is a certain percentage of the fair market value that is determined by local assessors to be the total taxable value of land and additions on the property. | Land | Improvement |
|---|---|---|---|---|
| 2025 | $794 | $149,600 | $29,920 | $119,680 |
| 2024 | $794 | $149,600 | $29,920 | $119,680 |
| 2023 | $794 | $56,700 | $8,400 | $48,300 |
| 2022 | $794 | $56,700 | $8,400 | $48,300 |
| 2021 | $794 | $0 | $0 | $0 |
| 2020 | $794 | $0 | $0 | $0 |
| 2019 | $764 | $0 | $0 | $0 |
| 2018 | $620 | $0 | $0 | $0 |
| 2017 | $620 | $0 | $0 | $0 |
| 2016 | $620 | $0 | $0 | $0 |
| 2015 | $4,329 | $0 | $0 | $0 |
| 2014 | -- | $44,300 | $3,941 | $40,359 |
| 2012 | -- | $5,152 | $1,005 | $4,147 |
Source: Public Records
Map
Nearby Homes