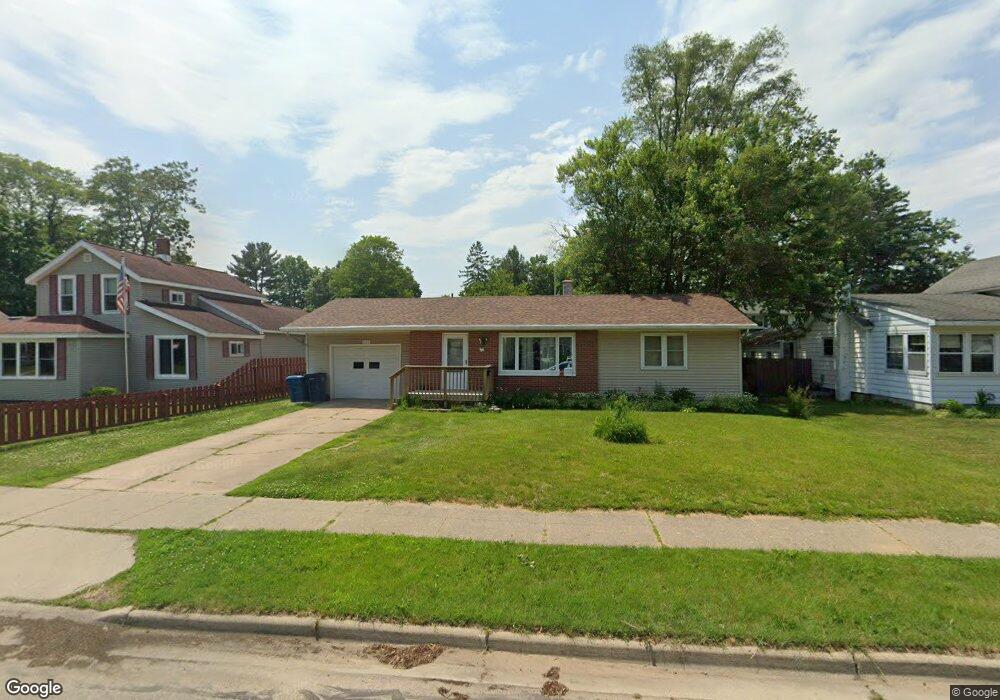
229 N Main St Wayland, MI 49348
Estimated Value: $238,000 - $259,877
2
Beds
1
Bath
988
Sq Ft
$252/Sq Ft
Est. Value
About This Home
This home is located at 229 N Main St, Wayland, MI 49348 and is currently estimated at $249,219, approximately $252 per square foot. 229 N Main St is a home located in Allegan County with nearby schools including Wayland High School and St. Therese Catholic School.
Ownership History
Date
Name
Owned For
Owner Type
Purchase Details
Closed on
Feb 8, 2018
Sold by
Boulter Tiffany
Bought by
Genther Amber
Current Estimated Value
Home Financials for this Owner
Home Financials are based on the most recent Mortgage that was taken out on this home.
Original Mortgage
$65,000
Outstanding Balance
$55,049
Interest Rate
3.99%
Mortgage Type
New Conventional
Estimated Equity
$194,170
Purchase Details
Closed on
Apr 21, 2011
Sold by
Boulter Tiffany
Bought by
Boulter Tiffany
Create a Home Valuation Report for This Property
The Home Valuation Report is an in-depth analysis detailing your home's value as well as a comparison with similar homes in the area
Home Values in the Area
Average Home Value in this Area
Purchase History
| Date | Buyer | Sale Price | Title Company |
|---|---|---|---|
| Genther Amber | $82,000 | Bell Title Agency | |
| Boulter Tiffany | -- | None Available |
Source: Public Records
Mortgage History
| Date | Status | Borrower | Loan Amount |
|---|---|---|---|
| Open | Genther Amber | $65,000 |
Source: Public Records
Tax History Compared to Growth
Tax History
| Year | Tax Paid | Tax Assessment Tax Assessment Total Assessment is a certain percentage of the fair market value that is determined by local assessors to be the total taxable value of land and additions on the property. | Land | Improvement |
|---|---|---|---|---|
| 2025 | $3,389 | $107,200 | $11,700 | $95,500 |
| 2024 | $3,078 | $97,400 | $9,400 | $88,000 |
| 2023 | $3,078 | $84,700 | $8,600 | $76,100 |
| 2022 | $3,078 | $75,500 | $7,900 | $67,600 |
| 2021 | $2,886 | $69,200 | $7,600 | $61,600 |
| 2020 | $2,886 | $66,400 | $7,600 | $58,800 |
| 2019 | $0 | $64,200 | $7,400 | $56,800 |
| 2018 | $0 | $60,700 | $7,400 | $53,300 |
| 2017 | $0 | $61,600 | $7,400 | $54,200 |
| 2016 | $0 | $50,100 | $5,800 | $44,300 |
| 2015 | -- | $50,100 | $5,800 | $44,300 |
| 2014 | -- | $44,100 | $5,800 | $38,300 |
| 2013 | -- | $40,100 | $5,800 | $34,300 |
Source: Public Records
Map
Nearby Homes
- 212 E Superior St
- 146 Hanlon Ct
- 545 N Main St
- 110 E Sycamore St
- 219 Alpine St
- 319 Alpine St
- 621 S Main St
- 3610 Garden St
- 3570 Windsor Woods Dr
- 1143 Regina Trail
- 3770 Division Ave S
- 3685 Calkins Ct
- 330 Lotz Ct
- 835 Wild Flower Ct
- 4674 12th St
- 3282 Stonehill Ct
- 3296 Stonehill Ct
- 3897 Division St
- 3214 7th St
- 3669 Kalamazoo Dr