Estimated Value: $357,000 - $516,554
5
Beds
4
Baths
2,844
Sq Ft
$157/Sq Ft
Est. Value
About This Home
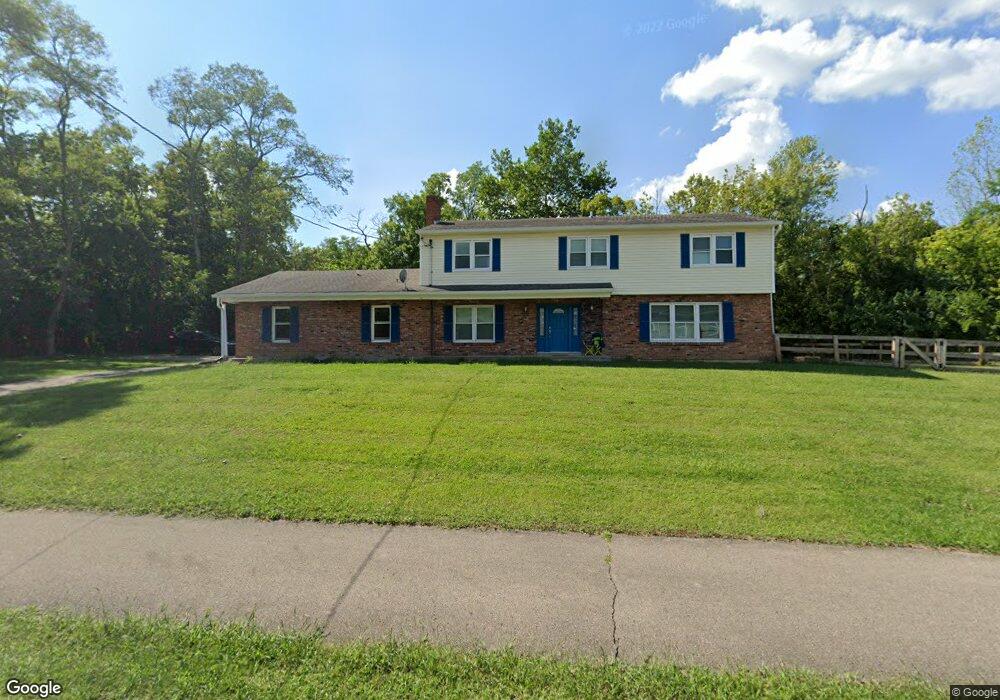
This home is located at 229 N Mason Montgomery Rd, Mason, OH 45040 and is currently estimated at $447,639, approximately $157 per square foot. 229 N Mason Montgomery Rd is a home located in Warren County with nearby schools including Mason Intermediate Elementary School, Mason Middle School, and William Mason High School.
Ownership History
Date
Name
Owned For
Owner Type
Purchase Details
Closed on
Nov 8, 2019
Sold by
Yost Jack M
Bought by
Yost Michael E and Yost Stephanie L
Current Estimated Value
Home Financials for this Owner
Home Financials are based on the most recent Mortgage that was taken out on this home.
Original Mortgage
$162,800
Outstanding Balance
$143,279
Interest Rate
3.62%
Mortgage Type
FHA
Estimated Equity
$304,360
Purchase Details
Closed on
Jan 23, 2008
Sold by
Yost Jr Jack M
Bought by
City Of Mason
Purchase Details
Closed on
Mar 1, 2007
Sold by
Yost Jack M and Yost Teresa L
Bought by
Yost Jack M
Home Financials for this Owner
Home Financials are based on the most recent Mortgage that was taken out on this home.
Original Mortgage
$134,000
Interest Rate
6.25%
Mortgage Type
New Conventional
Purchase Details
Closed on
Jul 3, 1991
Sold by
Yost Yost and Yost Jack A
Bought by
Zambon Zambon and Zambon Georgia Susan
Create a Home Valuation Report for This Property
The Home Valuation Report is an in-depth analysis detailing your home's value as well as a comparison with similar homes in the area
Home Values in the Area
Average Home Value in this Area
Purchase History
| Date | Buyer | Sale Price | Title Company |
|---|---|---|---|
| Yost Michael E | $210,000 | American Homeland Title | |
| City Of Mason | -- | Attorney | |
| Yost Jack M | -- | Priority Land Title | |
| Zambon Zambon | $110,000 | -- |
Source: Public Records
Mortgage History
| Date | Status | Borrower | Loan Amount |
|---|---|---|---|
| Open | Yost Michael E | $162,800 | |
| Previous Owner | Yost Jack M | $134,000 |
Source: Public Records
Tax History Compared to Growth
Tax History
| Year | Tax Paid | Tax Assessment Tax Assessment Total Assessment is a certain percentage of the fair market value that is determined by local assessors to be the total taxable value of land and additions on the property. | Land | Improvement |
|---|---|---|---|---|
| 2024 | $4,168 | $102,670 | $27,230 | $75,440 |
| 2023 | $3,867 | $80,493 | $13,583 | $66,909 |
| 2022 | $3,817 | $80,493 | $13,584 | $66,910 |
| 2021 | $3,616 | $80,493 | $13,584 | $66,910 |
| 2020 | $3,429 | $65,440 | $11,043 | $54,397 |
| 2019 | $3,153 | $65,440 | $11,043 | $54,397 |
| 2018 | $3,163 | $65,440 | $11,043 | $54,397 |
| 2017 | $3,262 | $62,990 | $10,819 | $52,171 |
| 2016 | $3,360 | $62,990 | $10,819 | $52,171 |
| 2015 | $3,367 | $62,990 | $10,819 | $52,171 |
| 2014 | $3,506 | $61,170 | $10,520 | $50,650 |
| 2013 | $3,514 | $64,360 | $11,040 | $53,320 |
Source: Public Records
Map
Nearby Homes
- 0 Mason Montgomery Rd Unit 944480
- 0 Mason Montgomery Rd Unit 1856522
- 0 Mason Montgomery Rd Unit 1846782
- 5130 Franklin Park St
- 5239 Concord Crossing Dr
- 4821 Bordeaux Ln Unit 4821
- 216 Short St
- 4734 Margaret Ct
- 4684 Court Yard Dr
- 4643 Court Yard Dr Unit 64
- 4484 Pond Meadows Ct
- 220 Kings Mills Rd
- 0 U S Highway 42
- 226 Kings Mills Rd
- 4521 Springhouse Ct
- 4874 Shagbark Ct
- 5088 Carter Ct
- 5065 Birchwood Farms Dr
- 5662 Hawthorn Ct
- Vanderburgh Plan at Ivy Lane
- 104 W North St
- 228 N Mason Montgomery Rd
- 102 E North St
- 5109 Concord Hills Cir
- 110 W North St
- 5113 Concord Hills Cir
- 5105 Concord Hills Cir
- 108 W North St
- 5099 Concord Hills Cir
- 226 N Mason Montgomery Rd
- 5087 Concord Hills Cir
- 5083 Concord Hills Cir
- 112 W North St
- 226 E Us Highway 22 and 3
- 226 E Us Highway 22 and 3
- 5085 Concord Hills Cir
- 5081 Concord Hills Cir
- 5114 Concord Hills Cir
- 218 N East St
- 5077 Concord Hills Cir