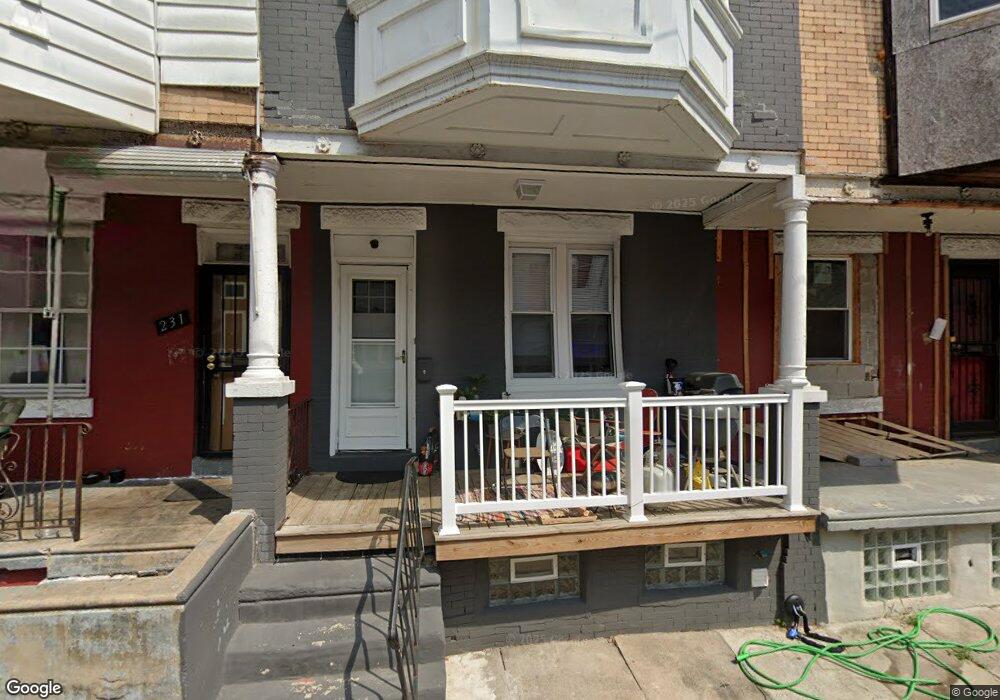
229 N Ruby St Philadelphia, PA 19139
Haddington NeighborhoodEstimated Value: $86,000 - $159,000
3
Beds
1
Bath
1,140
Sq Ft
$104/Sq Ft
Est. Value
About This Home
This home is located at 229 N Ruby St, Philadelphia, PA 19139 and is currently estimated at $118,493, approximately $103 per square foot. 229 N Ruby St is a home located in Philadelphia County with nearby schools including Overbrook High School.
Ownership History
Date
Name
Owned For
Owner Type
Purchase Details
Closed on
Feb 15, 2021
Sold by
229 N Ruby St Llc
Bought by
Dominic & Sons Llc
Current Estimated Value
Home Financials for this Owner
Home Financials are based on the most recent Mortgage that was taken out on this home.
Original Mortgage
$113,400
Outstanding Balance
$101,192
Interest Rate
2.7%
Mortgage Type
Commercial
Estimated Equity
$17,301
Purchase Details
Closed on
Dec 27, 2019
Sold by
Mojarad Abe
Bought by
229 N Ruby St Llc
Home Financials for this Owner
Home Financials are based on the most recent Mortgage that was taken out on this home.
Original Mortgage
$50,000
Interest Rate
3.74%
Mortgage Type
Unknown
Purchase Details
Closed on
Jul 1, 2009
Sold by
Favors Charles L and Favors Deloris H
Bought by
Mojarad Abe
Create a Home Valuation Report for This Property
The Home Valuation Report is an in-depth analysis detailing your home's value as well as a comparison with similar homes in the area
Home Values in the Area
Average Home Value in this Area
Purchase History
| Date | Buyer | Sale Price | Title Company |
|---|---|---|---|
| Dominic & Sons Llc | $60,000 | None Available | |
| 229 N Ruby St Llc | $50,000 | Prosperity Abstract Llc | |
| Mojarad Abe | $4,000 | None Available |
Source: Public Records
Mortgage History
| Date | Status | Borrower | Loan Amount |
|---|---|---|---|
| Open | Dominic & Sons Llc | $113,400 | |
| Previous Owner | 229 N Ruby St Llc | $50,000 |
Source: Public Records
Tax History
| Year | Tax Paid | Tax Assessment Tax Assessment Total Assessment is a certain percentage of the fair market value that is determined by local assessors to be the total taxable value of land and additions on the property. | Land | Improvement |
|---|---|---|---|---|
| 2026 | $1,039 | $98,800 | $19,760 | $79,040 |
| 2025 | $1,039 | $98,800 | $19,760 | $79,040 |
| 2024 | $1,039 | $98,800 | $19,760 | $79,040 |
| 2023 | $1,039 | $74,200 | $14,840 | $59,360 |
| 2022 | $694 | $74,200 | $14,840 | $59,360 |
| 2021 | $694 | $0 | $0 | $0 |
| 2020 | $694 | $0 | $0 | $0 |
| 2019 | $669 | $0 | $0 | $0 |
| 2017 | $591 | $0 | $0 | $0 |
Source: Public Records
Map
Nearby Homes
Your Personal Tour Guide
Ask me questions while you tour the home.