Estimated Value: $97,000 - $241,000
3
Beds
2
Baths
2,016
Sq Ft
$88/Sq Ft
Est. Value
About This Home
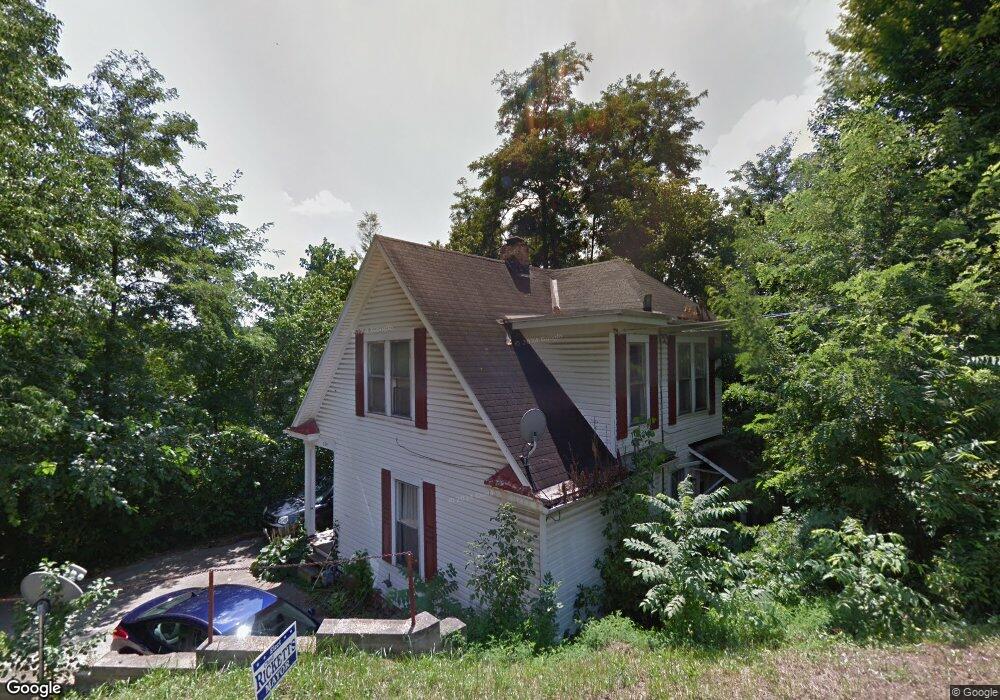
This home is located at 229 N Spring St, Logan, OH 43138 and is currently estimated at $177,827, approximately $88 per square foot. 229 N Spring St is a home located in Hocking County with nearby schools including Central Elementary School, St. John the Evangelist School, and Logan Christian School.
Ownership History
Date
Name
Owned For
Owner Type
Purchase Details
Closed on
Oct 22, 2024
Sold by
Allison Jonathan and Allison Jonathon W
Bought by
Jt Portfolio Investments Llc
Current Estimated Value
Purchase Details
Closed on
Aug 13, 2024
Sold by
Roley Steven E and Roley Rebecca
Bought by
Allison Jonathan and Murray Tiffany
Create a Home Valuation Report for This Property
The Home Valuation Report is an in-depth analysis detailing your home's value as well as a comparison with similar homes in the area
Home Values in the Area
Average Home Value in this Area
Purchase History
| Date | Buyer | Sale Price | Title Company |
|---|---|---|---|
| Jt Portfolio Investments Llc | -- | Downtown Title | |
| Allison Jonathan | $52,575 | Sas Title |
Source: Public Records
Tax History
| Year | Tax Paid | Tax Assessment Tax Assessment Total Assessment is a certain percentage of the fair market value that is determined by local assessors to be the total taxable value of land and additions on the property. | Land | Improvement |
|---|---|---|---|---|
| 2024 | $1,165 | $28,870 | $8,620 | $20,250 |
| 2023 | $1,165 | $28,870 | $8,620 | $20,250 |
| 2022 | $1,167 | $28,870 | $8,620 | $20,250 |
| 2021 | $1,017 | $23,920 | $6,910 | $17,010 |
| 2020 | $1,018 | $23,920 | $6,910 | $17,010 |
| 2019 | $1,018 | $23,920 | $6,910 | $17,010 |
| 2018 | $928 | $22,190 | $5,830 | $16,360 |
| 2017 | $873 | $22,190 | $5,830 | $16,360 |
| 2016 | $867 | $22,190 | $5,830 | $16,360 |
| 2015 | $751 | $18,520 | $5,390 | $13,130 |
| 2014 | $751 | $18,520 | $5,390 | $13,130 |
| 2013 | $754 | $18,520 | $5,390 | $13,130 |
Source: Public Records
Map
Nearby Homes
- 185 N Spring St
- 103 Mound St
- 167 N Spring St
- 232 N Spring St
- 186 Spring Hill Place
- 123 Mound St
- 212 N Spring St
- 144 W Hunter St
- 154 W Hunter St
- 135 N Spring St
- 142 N High St
- 155 Mound St
- 198 Spring Hill Place
- 166 W Hunter St
- 116 W Hunter St
- 112 Mound St
- 106 W Hunter St
- 167 Mound St
- 132 Mound St
- 75 Hill Rd
Your Personal Tour Guide
Ask me questions while you tour the home.