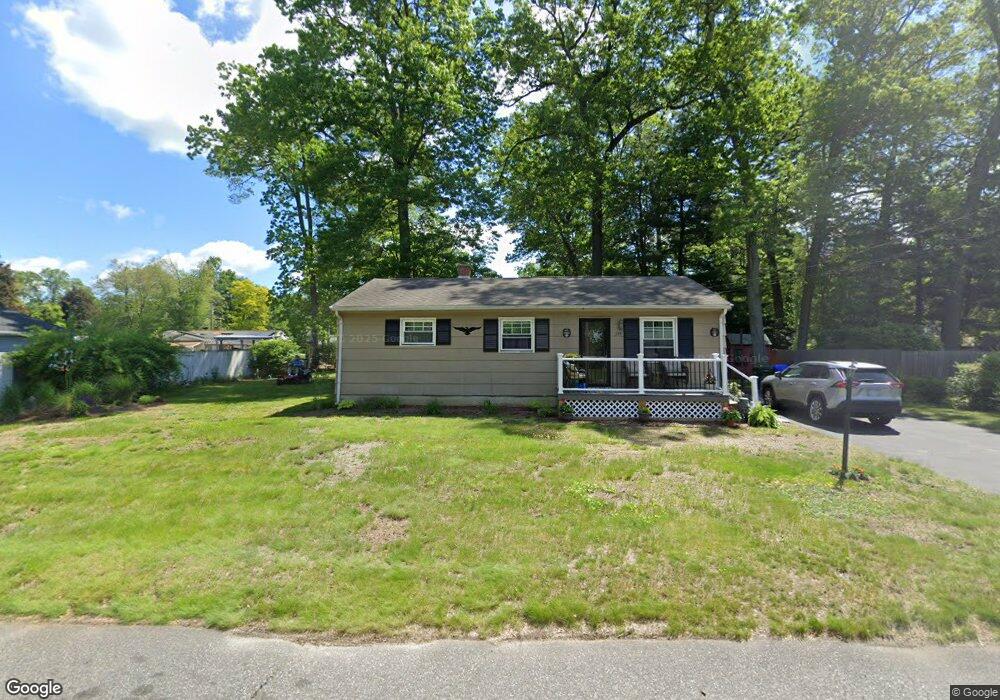
229 Newhouse St Springfield, MA 01118
Sixteen Acres NeighborhoodEstimated Value: $269,000 - $326,000
3
Beds
1
Bath
1,053
Sq Ft
$277/Sq Ft
Est. Value
About This Home
This home is located at 229 Newhouse St, Springfield, MA 01118 and is currently estimated at $292,183, approximately $277 per square foot. 229 Newhouse St is a home located in Hampden County with nearby schools including Arthur T Talmadge Elementary School, M Marcus Kiley Middle, and Springfield High School of Science and Technology.
Ownership History
Date
Name
Owned For
Owner Type
Purchase Details
Closed on
Dec 28, 2021
Sold by
Groves Abigail
Bought by
Groves Margaret
Current Estimated Value
Home Financials for this Owner
Home Financials are based on the most recent Mortgage that was taken out on this home.
Original Mortgage
$136,500
Outstanding Balance
$123,737
Interest Rate
2.98%
Mortgage Type
Purchase Money Mortgage
Estimated Equity
$168,446
Create a Home Valuation Report for This Property
The Home Valuation Report is an in-depth analysis detailing your home's value as well as a comparison with similar homes in the area
Home Values in the Area
Average Home Value in this Area
Purchase History
We collect this data history from publicly available records. To have your information removed, we recommend requesting removal directly through your county’s website.
| Date | Buyer | Sale Price | Title Company |
|---|---|---|---|
| Groves Margaret | $195,000 | None Available |
Source: Public Records
Mortgage History
We collect this data history from publicly available records. To have your information removed, we recommend requesting removal directly through your county’s website.
| Date | Status | Borrower | Loan Amount |
|---|---|---|---|
| Open | Groves Margaret | $136,500 |
Source: Public Records
Tax History
| Year | Tax Paid | Tax Assessment Tax Assessment Total Assessment is a certain percentage of the fair market value that is determined by local assessors to be the total taxable value of land and additions on the property. | Land | Improvement |
|---|---|---|---|---|
| 2025 | $3,791 | $241,800 | $58,300 | $183,500 |
| 2024 | $3,512 | $218,700 | $58,300 | $160,400 |
| 2023 | $3,277 | $192,200 | $55,400 | $136,800 |
| 2022 | $3,064 | $162,800 | $55,400 | $107,400 |
| 2021 | $2,759 | $146,000 | $50,400 | $95,600 |
| 2020 | $2,818 | $144,300 | $50,400 | $93,900 |
| 2019 | $2,688 | $136,600 | $50,400 | $86,200 |
| 2018 | $2,304 | $134,300 | $50,400 | $83,900 |
| 2017 | $2,479 | $126,100 | $50,400 | $75,700 |
| 2016 | $2,432 | $123,700 | $50,400 | $73,300 |
| 2015 | $2,402 | $122,100 | $50,400 | $71,700 |
Source: Public Records
Map
Nearby Homes
- 241 Newhouse St
- 35 Park Forest Rd
- 232 Talmadge Dr
- 242 Talmadge Dr
- 224 Talmadge Dr
- 228 Newhouse St
- 250 Talmadge Dr
- 238 Newhouse St
- 250 Talmadge Dr
- 218 Newhouse St
- 251 Newhouse St
- 246 Newhouse St
- 260 Talmadge Dr
- 205 Newhouse St
- 231 Talmadge Dr
- 210 Talmadge Dr
- 241 Talmadge Dr
- 256 Newhouse St
- 223 Talmadge Dr
- 204 Newhouse St
Your Personal Tour Guide
Ask me questions while you tour the home.