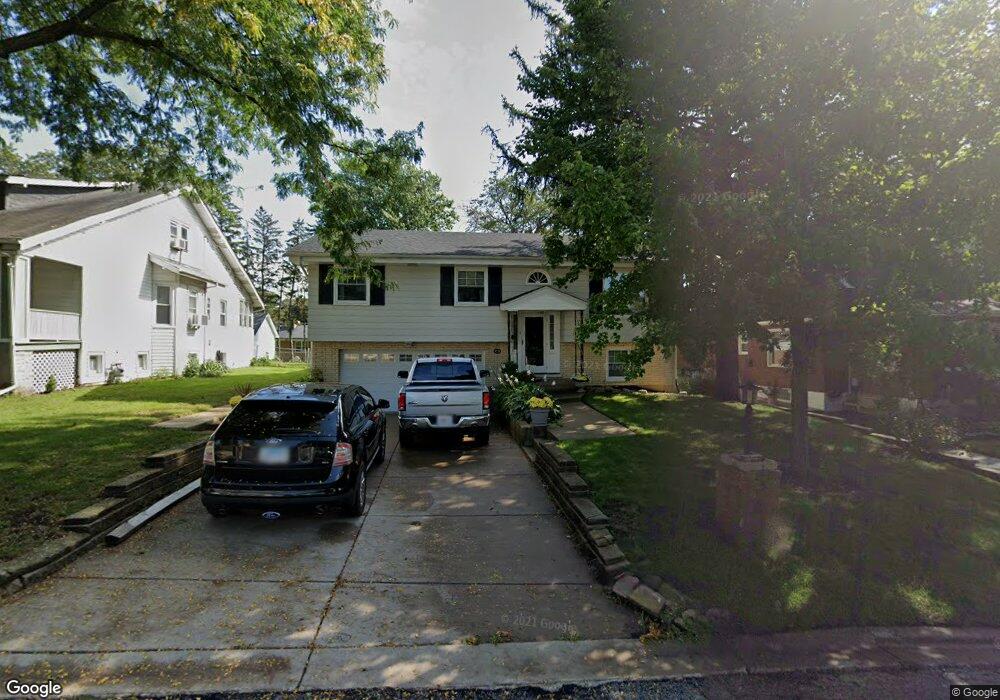
229 Orchard Ave Hillside, IL 60162
Estimated Value: $297,674 - $353,000
3
Beds
2
Baths
1,188
Sq Ft
$277/Sq Ft
Est. Value
About This Home
This home is located at 229 Orchard Ave, Hillside, IL 60162 and is currently estimated at $329,669, approximately $277 per square foot. 229 Orchard Ave is a home located in Cook County with nearby schools including Hillside Elementary School and Proviso West High School.
Ownership History
Date
Name
Owned For
Owner Type
Purchase Details
Closed on
May 1, 2013
Sold by
Federal Home Loan Mortgage Corporation
Bought by
Castillo Eric
Current Estimated Value
Home Financials for this Owner
Home Financials are based on the most recent Mortgage that was taken out on this home.
Original Mortgage
$144,337
Interest Rate
3.87%
Mortgage Type
FHA
Purchase Details
Closed on
Jan 14, 2005
Sold by
Korzen Leonard and Korzen Frances C
Bought by
Taylor Ernest and Taylor Rose
Home Financials for this Owner
Home Financials are based on the most recent Mortgage that was taken out on this home.
Original Mortgage
$194,000
Interest Rate
5.83%
Mortgage Type
Unknown
Create a Home Valuation Report for This Property
The Home Valuation Report is an in-depth analysis detailing your home's value as well as a comparison with similar homes in the area
Home Values in the Area
Average Home Value in this Area
Purchase History
| Date | Buyer | Sale Price | Title Company |
|---|---|---|---|
| Castillo Eric | $147,000 | Attorneys Title Guaranty Fun | |
| Taylor Ernest | $244,000 | Pntn |
Source: Public Records
Mortgage History
| Date | Status | Borrower | Loan Amount |
|---|---|---|---|
| Previous Owner | Castillo Eric | $144,337 | |
| Previous Owner | Taylor Ernest | $194,000 |
Source: Public Records
Tax History
| Year | Tax Paid | Tax Assessment Tax Assessment Total Assessment is a certain percentage of the fair market value that is determined by local assessors to be the total taxable value of land and additions on the property. | Land | Improvement |
|---|---|---|---|---|
| 2025 | $5,820 | $23,001 | $3,548 | $19,453 |
| 2024 | $5,820 | $23,001 | $3,548 | $19,453 |
| 2023 | $4,747 | $23,001 | $3,548 | $19,453 |
| 2022 | $4,747 | $18,811 | $3,064 | $15,747 |
| 2021 | $3,451 | $18,809 | $3,063 | $15,746 |
| 2020 | $6,730 | $18,809 | $3,063 | $15,746 |
| 2019 | $6,044 | $15,851 | $2,741 | $13,110 |
| 2018 | $5,873 | $15,851 | $2,741 | $13,110 |
| 2017 | $5,650 | $15,851 | $2,741 | $13,110 |
| 2016 | $5,194 | $14,279 | $2,418 | $11,861 |
| 2015 | $5,027 | $14,279 | $2,418 | $11,861 |
| 2014 | $4,895 | $14,279 | $2,418 | $11,861 |
| 2013 | $4,935 | $15,735 | $2,418 | $13,317 |
Source: Public Records
Map
Nearby Homes
- 11011 W Roosevelt Rd
- 1245 S Mannheim Rd Unit 2
- 723 Balmoral Ave
- 10567 Waterford Dr
- 813 Westchester Blvd
- 1244 Westchester Blvd
- 1102 Marshall Ave
- 1043 Marshall Ave
- 326 N Forest Ave
- 311 Buckthorn Ln
- 70 N Laverne Ave
- 3912 Adams St
- 1105 Bellwood Ave
- 1348 Hull Ave
- 1124 Linden Ave
- 1013 Bellwood Ave
- 1624 Boeger Ave
- 11053 Mandel Ave
- 932 Bellwood Ave
- 920 Suffolk Ave
- 229 Orchard St
- 225 Orchard St
- 237 Orchard St
- 221 Orchard Ave
- 221 Orchard St
- 217 Orchard Ave
- 230 Orchard St
- 217 Orchard St
- 226 Orchard St
- 4342 Edgewater Ave
- 222 Orchard St
- 232 Oak Ridge Ave
- 213 Orchard St
- 226 Oak Ridge Ave
- 226 Oak Ridge Ave
- 236 Oak Ridge Ave
- 4325 Edgewater Ave
- 218 Oak Ridge Ave
- 218 Orchard St
- 218 Orchard St
Your Personal Tour Guide
Ask me questions while you tour the home.