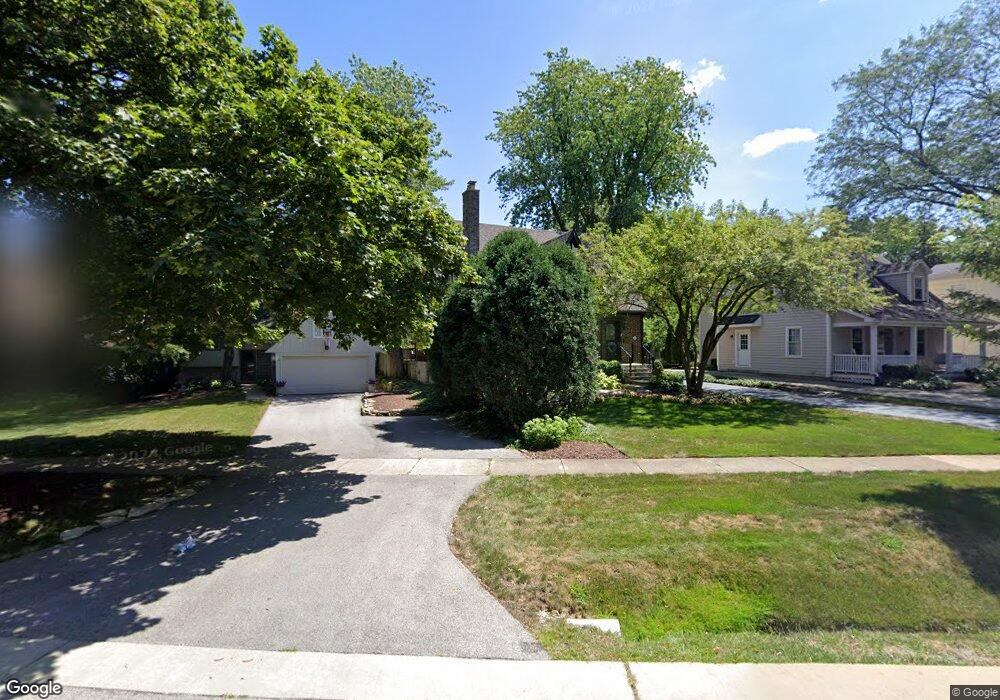
229 Powell St Clarendon Hills, IL 60514
Estimated Value: $871,000 - $1,274,000
--
Bed
--
Bath
2,513
Sq Ft
$414/Sq Ft
Est. Value
About This Home
This home is located at 229 Powell St, Clarendon Hills, IL 60514 and is currently estimated at $1,040,172, approximately $413 per square foot. 229 Powell St is a home located in DuPage County with nearby schools including Walker Elementary School, Danielle-Joy Peterson Elementary School, and Clarendon Hills Middle School.
Ownership History
Date
Name
Owned For
Owner Type
Purchase Details
Closed on
Apr 30, 2003
Sold by
Smith Daniel Robert and Smith Gail Mitchell
Bought by
Malcolm Richard J and Malcolm Anne K
Current Estimated Value
Home Financials for this Owner
Home Financials are based on the most recent Mortgage that was taken out on this home.
Original Mortgage
$300,000
Outstanding Balance
$132,568
Interest Rate
6.02%
Mortgage Type
Purchase Money Mortgage
Estimated Equity
$907,604
Purchase Details
Closed on
Apr 13, 1996
Sold by
Marino Glenn P and Marino Lauren A
Bought by
Smith Daniel Robert and Smith Gail Mitchell
Home Financials for this Owner
Home Financials are based on the most recent Mortgage that was taken out on this home.
Original Mortgage
$225,150
Interest Rate
7.75%
Create a Home Valuation Report for This Property
The Home Valuation Report is an in-depth analysis detailing your home's value as well as a comparison with similar homes in the area
Home Values in the Area
Average Home Value in this Area
Purchase History
| Date | Buyer | Sale Price | Title Company |
|---|---|---|---|
| Malcolm Richard J | $770,000 | Ticor | |
| Smith Daniel Robert | $23,666 | First American Title |
Source: Public Records
Mortgage History
| Date | Status | Borrower | Loan Amount |
|---|---|---|---|
| Open | Malcolm Richard J | $300,000 | |
| Previous Owner | Smith Daniel Robert | $225,150 | |
| Closed | Malcolm Richard J | $100,000 |
Source: Public Records
Tax History Compared to Growth
Tax History
| Year | Tax Paid | Tax Assessment Tax Assessment Total Assessment is a certain percentage of the fair market value that is determined by local assessors to be the total taxable value of land and additions on the property. | Land | Improvement |
|---|---|---|---|---|
| 2024 | $15,984 | $275,940 | $84,730 | $191,210 |
| 2023 | $16,328 | $275,140 | $77,890 | $197,250 |
| 2022 | $15,764 | $268,170 | $75,920 | $192,250 |
| 2021 | $15,292 | $265,120 | $75,060 | $190,060 |
| 2020 | $15,014 | $259,870 | $73,570 | $186,300 |
| 2019 | $14,933 | $249,350 | $70,590 | $178,760 |
| 2018 | $15,054 | $259,740 | $70,210 | $189,530 |
| 2017 | $14,538 | $249,940 | $67,560 | $182,380 |
| 2016 | $14,280 | $238,540 | $64,480 | $174,060 |
| 2015 | $14,194 | $224,420 | $60,660 | $163,760 |
| 2014 | $12,327 | $197,430 | $58,980 | $138,450 |
| 2013 | $12,093 | $196,500 | $58,700 | $137,800 |
Source: Public Records
Map
Nearby Homes
- 217 55th St
- 5513 Barclay Ct Unit 36
- 5524 S Bruner St
- 815 W 56th St
- 564 Willowcreek Ct Unit 411
- 16W674 56th Place
- 5515 Alabama Ave
- 551 Carlysle Dr Unit 2
- 530 Chase Dr Unit 4
- 5740 Concord Ln Unit 12
- 322 Park Ave Unit 2A
- 346 55th St
- 5701 Clarendon Hills Rd
- 5804 58th St Unit 5804
- 5806 58th St Unit 5804
- 372 55th St
- 5848 Clarendon Hills Rd
- 147 Chicago Ave
- 303 Reserve Cir
- 5720 S Madison St