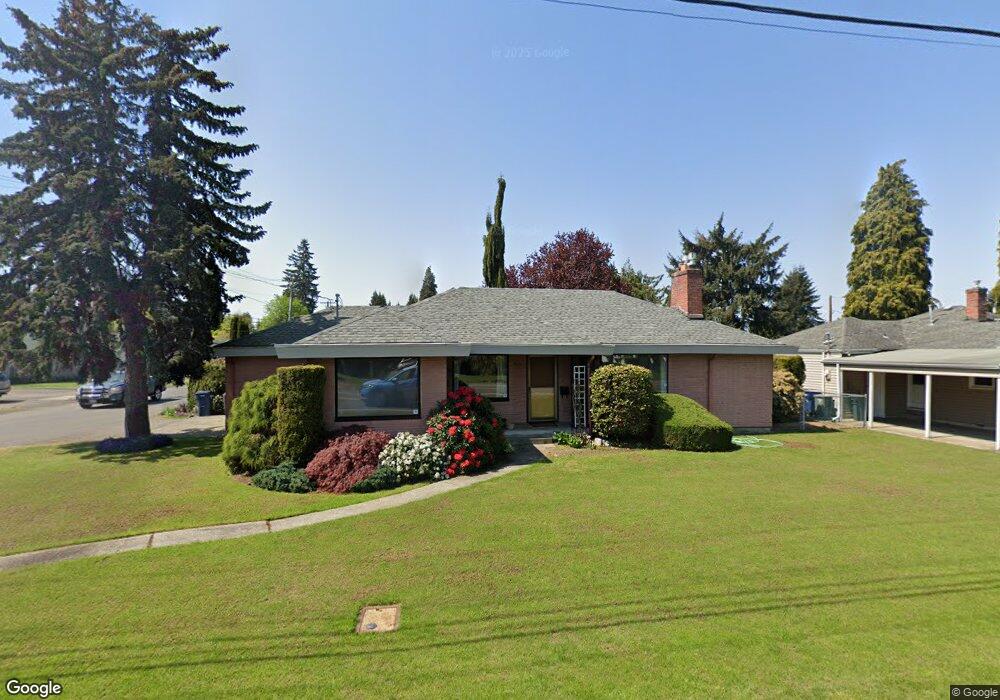
229 R St SE Auburn, WA 98002
Plateau NeighborhoodEstimated Value: $496,000 - $571,401
3
Beds
1
Bath
2,010
Sq Ft
$266/Sq Ft
Est. Value
About This Home
This home is located at 229 R St SE, Auburn, WA 98002 and is currently estimated at $535,600, approximately $266 per square foot. 229 R St SE is a home located in King County with nearby schools including Washington Elementary School, Cascade Middle School, and Auburn High School.
Ownership History
Date
Name
Owned For
Owner Type
Purchase Details
Closed on
Oct 26, 2001
Sold by
Juan R Huseby Living Trust and Booth Charles A
Bought by
Georgi Ryan M
Current Estimated Value
Home Financials for this Owner
Home Financials are based on the most recent Mortgage that was taken out on this home.
Original Mortgage
$157,629
Outstanding Balance
$62,290
Interest Rate
6.87%
Mortgage Type
FHA
Estimated Equity
$473,310
Purchase Details
Closed on
Nov 9, 1999
Sold by
Huseby Juan R
Bought by
Booth Charles A
Purchase Details
Closed on
Nov 13, 1996
Sold by
Huseby Juan Ruth
Bought by
Huseby Juan Ruth
Create a Home Valuation Report for This Property
The Home Valuation Report is an in-depth analysis detailing your home's value as well as a comparison with similar homes in the area
Home Values in the Area
Average Home Value in this Area
Purchase History
| Date | Buyer | Sale Price | Title Company |
|---|---|---|---|
| Georgi Ryan M | -- | Washington Title | |
| Booth Charles A | -- | -- | |
| Huseby Juan R | -- | -- | |
| Huseby Juan Ruth | -- | -- |
Source: Public Records
Mortgage History
| Date | Status | Borrower | Loan Amount |
|---|---|---|---|
| Open | Georgi Ryan M | $157,629 |
Source: Public Records
Tax History Compared to Growth
Tax History
| Year | Tax Paid | Tax Assessment Tax Assessment Total Assessment is a certain percentage of the fair market value that is determined by local assessors to be the total taxable value of land and additions on the property. | Land | Improvement |
|---|---|---|---|---|
| 2024 | $6,259 | $520,000 | $125,000 | $395,000 |
| 2023 | $5,724 | $457,000 | $100,000 | $357,000 |
| 2022 | $5,138 | $478,000 | $108,000 | $370,000 |
| 2021 | $5,025 | $380,000 | $87,000 | $293,000 |
| 2020 | $4,577 | $352,000 | $81,000 | $271,000 |
| 2018 | $4,504 | $319,000 | $77,000 | $242,000 |
| 2017 | $4,063 | $283,000 | $71,000 | $212,000 |
| 2016 | $3,564 | $255,000 | $68,000 | $187,000 |
| 2015 | $3,264 | $237,000 | $63,000 | $174,000 |
| 2014 | -- | $227,000 | $60,000 | $167,000 |
| 2013 | -- | $174,000 | $55,000 | $119,000 |
Source: Public Records
Map
Nearby Homes