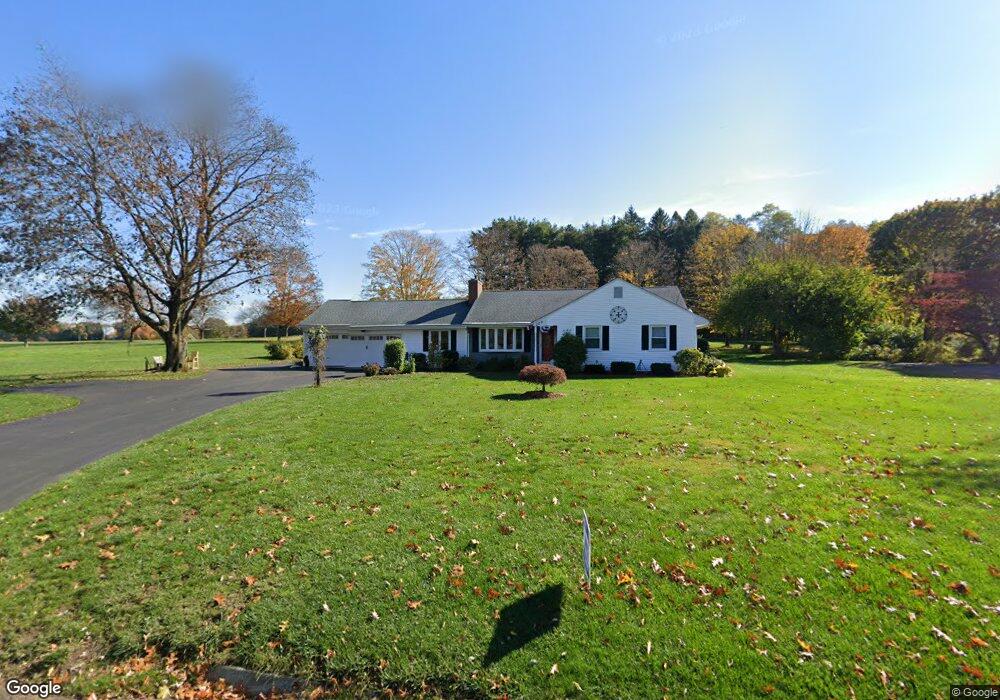
229 Rye St Broad Brook, CT 06016
Estimated Value: $356,000 - $406,000
3
Beds
2
Baths
1,580
Sq Ft
$237/Sq Ft
Est. Value
About This Home
This home is located at 229 Rye St, Broad Brook, CT 06016 and is currently estimated at $373,777, approximately $236 per square foot. 229 Rye St is a home located in Hartford County with nearby schools including Broad Brook Elementary School, East Windsor Middle School, and East Windsor High School.
Ownership History
Date
Name
Owned For
Owner Type
Purchase Details
Closed on
Oct 12, 2022
Sold by
Fhlm
Bought by
Rochette Francis C and Rochette Maureen A
Current Estimated Value
Purchase Details
Closed on
Nov 19, 2010
Sold by
Wells Fargo Bank Na
Bought by
Fhlmc
Home Financials for this Owner
Home Financials are based on the most recent Mortgage that was taken out on this home.
Original Mortgage
$142,437
Interest Rate
4.35%
Purchase Details
Closed on
Nov 10, 2010
Sold by
Fhlmc
Bought by
Rochette Maureen and Rochette Francis
Home Financials for this Owner
Home Financials are based on the most recent Mortgage that was taken out on this home.
Original Mortgage
$142,437
Interest Rate
4.35%
Purchase Details
Closed on
Nov 19, 2001
Sold by
Est Daly John Jr and Daly John
Bought by
Myette Randall
Create a Home Valuation Report for This Property
The Home Valuation Report is an in-depth analysis detailing your home's value as well as a comparison with similar homes in the area
Home Values in the Area
Average Home Value in this Area
Purchase History
| Date | Buyer | Sale Price | Title Company |
|---|---|---|---|
| Rochette Francis C | -- | None Available | |
| Fhlmc | -- | -- | |
| Rochette Maureen | $170,000 | -- | |
| Myette Randall | $92,500 | -- | |
| Myette Randall | $92,500 | -- |
Source: Public Records
Mortgage History
| Date | Status | Borrower | Loan Amount |
|---|---|---|---|
| Previous Owner | Myette Randall | $142,437 | |
| Previous Owner | Myette Randall | $120,016 | |
| Previous Owner | Myette Randall | $75,000 |
Source: Public Records
Tax History
| Year | Tax Paid | Tax Assessment Tax Assessment Total Assessment is a certain percentage of the fair market value that is determined by local assessors to be the total taxable value of land and additions on the property. | Land | Improvement |
|---|---|---|---|---|
| 2025 | $5,882 | $222,040 | $62,350 | $159,690 |
| 2024 | $5,453 | $222,040 | $62,350 | $159,690 |
| 2023 | $4,274 | $124,690 | $49,100 | $75,590 |
| 2022 | $4,474 | $124,690 | $49,100 | $75,590 |
| 2021 | $4,302 | $124,690 | $49,100 | $75,590 |
| 2020 | $4,329 | $124,690 | $49,100 | $75,590 |
| 2019 | $4,271 | $124,690 | $49,100 | $75,590 |
| 2018 | $4,227 | $124,690 | $49,100 | $75,590 |
| 2017 | $4,290 | $130,910 | $57,350 | $73,560 |
| 2016 | $4,049 | $130,910 | $57,350 | $73,560 |
| 2015 | $3,968 | $130,910 | $57,350 | $73,560 |
| 2014 | $3,898 | $130,910 | $57,350 | $73,560 |
Source: Public Records
Map
Nearby Homes
- 0 Ellsworth Rd
- 0 Chamberlain Rd Unit 24154561
- 133 Phelps Rd
- 20 Apothecaries Hall Rd
- 27 Folkstone Rd Unit C
- 10 Thistle Way Unit D
- 192 Scantic Meadow Rd
- 534 Rye St
- 814 Graham Rd
- 0 Abbe Rd
- 0 Thrall Rd Unit 24150600
- 43 W River Rd
- 17 Cathy (Lot 18) Ln
- 19 Cathy (Lot 19) Ln
- 23 Cathy (Lot 21) Ln
- 21 Ln
- 76 Griffin Rd
- 22 Cathy (Lot 15) Ln
- 18 Cathy (Lot 17) Ln
- 20 Cathy (Lot 16) Ln
Your Personal Tour Guide
Ask me questions while you tour the home.