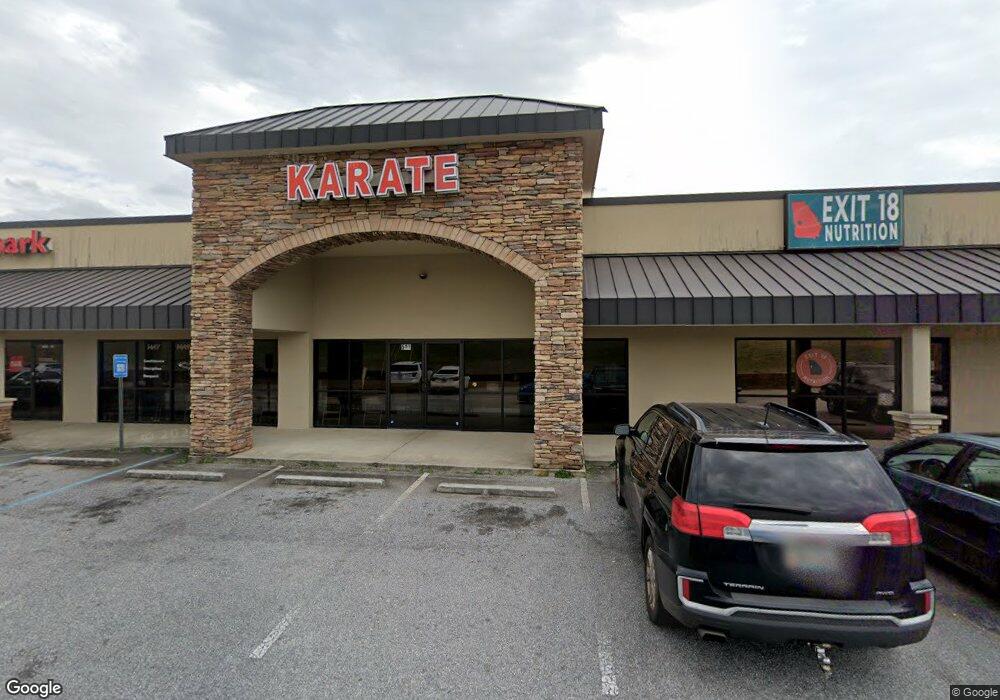
229 S Davis Rd Unit SUITE 400 La Grange, GA 30241
--
Bed
1
Bath
18,870
Sq Ft
1.95
Acres
About This Home
This home is located at 229 S Davis Rd Unit SUITE 400, La Grange, GA 30241. 229 S Davis Rd Unit SUITE 400 is a home located in Troup County with nearby schools including Franklin Forest Elementary School, Hollis Hand Elementary School, and Ethel W. Kight Elementary School.
Ownership History
Date
Name
Owned For
Owner Type
Purchase Details
Closed on
Jul 22, 2005
Sold by
Bmh Development Llc
Bought by
Edelson Stephen L and Jones Mark W
Home Financials for this Owner
Home Financials are based on the most recent Mortgage that was taken out on this home.
Original Mortgage
$271,102
Interest Rate
5.51%
Mortgage Type
Commercial
Purchase Details
Closed on
Dec 22, 2000
Sold by
Continental Rlec
Bought by
Bmh Dev Co Llc
Purchase Details
Closed on
Jun 16, 2000
Sold by
Continental Electrical Cont
Bought by
Continental Rlec
Purchase Details
Closed on
Dec 1, 1987
Sold by
Tab H H
Bought by
Continental Electrical Cont
Purchase Details
Closed on
Mar 1, 1986
Sold by
Thomas M Turner
Bought by
Tab H H
Purchase Details
Closed on
Jan 1, 1986
Sold by
I E S Incorporated
Bought by
Thomas M Turner
Purchase Details
Closed on
Mar 1, 1984
Sold by
Ray Adams
Bought by
I E S Incorporated
Create a Home Valuation Report for This Property
The Home Valuation Report is an in-depth analysis detailing your home's value as well as a comparison with similar homes in the area
Home Values in the Area
Average Home Value in this Area
Purchase History
| Date | Buyer | Sale Price | Title Company |
|---|---|---|---|
| Edelson Stephen L | $270,000 | -- | |
| Bmh Dev Co Llc | -- | -- | |
| Continental Rlec | -- | -- | |
| Continental Electrical Cont | -- | -- | |
| Tab H H | -- | -- | |
| Thomas M Turner | -- | -- | |
| I E S Incorporated | -- | -- |
Source: Public Records
Mortgage History
| Date | Status | Borrower | Loan Amount |
|---|---|---|---|
| Closed | Edelson Stephen L | $271,102 |
Source: Public Records
Tax History Compared to Growth
Tax History
| Year | Tax Paid | Tax Assessment Tax Assessment Total Assessment is a certain percentage of the fair market value that is determined by local assessors to be the total taxable value of land and additions on the property. | Land | Improvement |
|---|---|---|---|---|
| 2024 | $19,401 | $711,360 | $105,280 | $606,080 |
| 2023 | $18,314 | $671,520 | $105,280 | $566,240 |
| 2022 | $18,742 | $671,520 | $105,280 | $566,240 |
| 2021 | $15,484 | $513,400 | $105,280 | $408,120 |
| 2020 | $14,419 | $478,080 | $105,280 | $372,800 |
| 2019 | $15,052 | $499,080 | $105,280 | $393,800 |
| 2018 | $15,052 | $499,080 | $105,280 | $393,800 |
| 2017 | $15,052 | $499,080 | $105,280 | $393,800 |
| 2016 | $15,308 | $507,561 | $105,300 | $402,261 |
| 2015 | $15,083 | $499,258 | $105,300 | $393,958 |
| 2014 | $12,183 | $402,615 | $105,300 | $297,315 |
| 2013 | -- | $402,615 | $105,300 | $297,315 |
Source: Public Records
Map
Nearby Homes
- 2995 Hogansville Rd
- 200 River Meadow Dr
- 234 River Meadow Dr
- 112 Shenandoah Ln Unit 29E
- 112 Shenandoah Ln
- 114 Shenandoah Ln
- 114 Shenandoah Ln Unit 30E
- 116 Shenandoah Ln
- 143 Shenandoah Ln
- 145 Shenandoah Ln
- 147 Shenandoah Ln
- 130 Shenandoah Ln Unit A68
- 142 Shenandoah Ln
- 300 Glenhaven Dr Unit 1D
- 300 Glenhaven Dr
- 106 Shenandoah Ln
- Hemingway Plan at Crossvine Village
- Mira Plan at Crossvine Village
- Cecil Plan at Crossvine Village
- Tucker FP Plan at Crossvine Village
- 229 S Davis Rd Unit SUITE 500
- 229 S Davis Rd Unit SUITE 600
- 229 S Davis Rd Unit SUITE 100
- 229 S Davis Rd Unit SUITE 800
- 220 S Davis Rd Unit 200
- 218 S Davis Rd
- 218 S Davis Rd Unit 201
- 267 S Davis Rd
- 200 S Davis Rd Unit 210
- 202 S Davis Rd
- 253 S Davis Rd
- 325 S Davis Rd
- 125 Iris Dr
- 120 Iris Dr
- 142 Laura Dr
- 115 Iris Dr
- 109 Iris Dr
- 95 Iris Dr
- 121 Laura Dr
- 82 Iris Dr