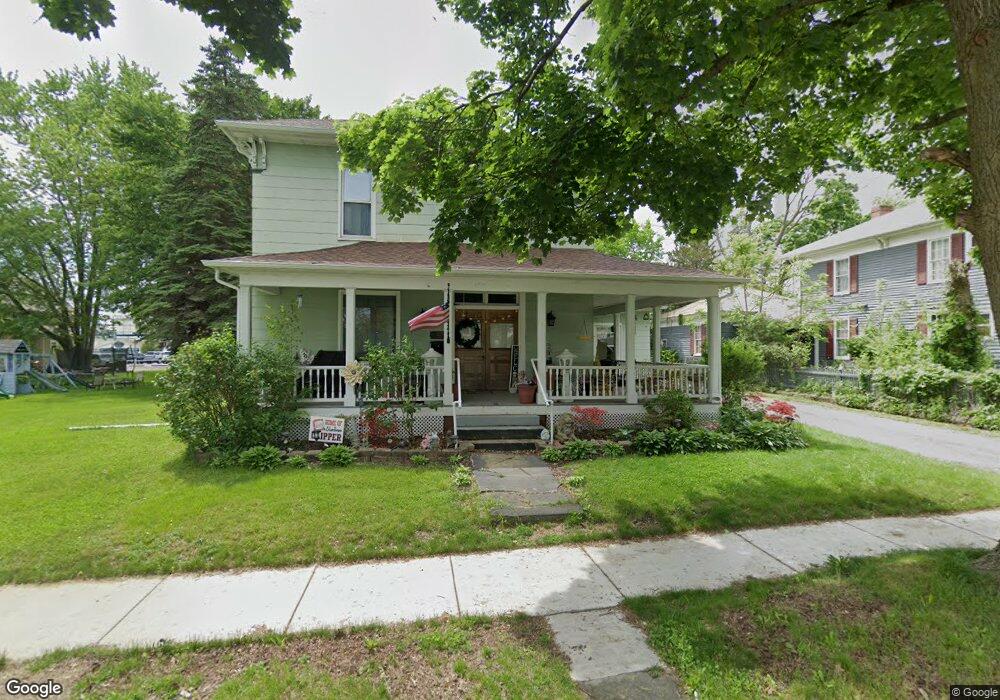
229 S Elm St Columbiana, OH 44408
Estimated Value: $133,976 - $165,000
3
Beds
2
Baths
2,092
Sq Ft
$70/Sq Ft
Est. Value
About This Home
This home is located at 229 S Elm St, Columbiana, OH 44408 and is currently estimated at $146,494, approximately $70 per square foot. 229 S Elm St is a home located in Columbiana County with nearby schools including Joshua Dixon Elementary School, South Side Middle School, and Columbiana High School.
Ownership History
Date
Name
Owned For
Owner Type
Purchase Details
Closed on
May 25, 2006
Sold by
Ham Matthew and Ham Kerrie A
Bought by
Moser Raymond L and Moser Kathleen I
Current Estimated Value
Home Financials for this Owner
Home Financials are based on the most recent Mortgage that was taken out on this home.
Original Mortgage
$78,400
Outstanding Balance
$45,820
Interest Rate
6.56%
Mortgage Type
Purchase Money Mortgage
Estimated Equity
$100,674
Purchase Details
Closed on
Mar 26, 1999
Sold by
Belden Properties Ltd
Bought by
Ham Matthew and Ham Kerrie A
Home Financials for this Owner
Home Financials are based on the most recent Mortgage that was taken out on this home.
Original Mortgage
$80,000
Interest Rate
6.85%
Mortgage Type
Construction
Purchase Details
Closed on
Sep 8, 1997
Sold by
Alexander Carolyn S and Alexander Carl H
Bought by
Belden Properties Ltd
Create a Home Valuation Report for This Property
The Home Valuation Report is an in-depth analysis detailing your home's value as well as a comparison with similar homes in the area
Home Values in the Area
Average Home Value in this Area
Purchase History
| Date | Buyer | Sale Price | Title Company |
|---|---|---|---|
| Moser Raymond L | $98,000 | None Available | |
| Ham Matthew | $40,500 | Heritage Title Agency | |
| Belden Properties Ltd | -- | -- |
Source: Public Records
Mortgage History
| Date | Status | Borrower | Loan Amount |
|---|---|---|---|
| Open | Moser Raymond L | $78,400 | |
| Closed | Ham Matthew | $80,000 |
Source: Public Records
Tax History Compared to Growth
Tax History
| Year | Tax Paid | Tax Assessment Tax Assessment Total Assessment is a certain percentage of the fair market value that is determined by local assessors to be the total taxable value of land and additions on the property. | Land | Improvement |
|---|---|---|---|---|
| 2024 | $924 | $26,920 | $6,200 | $20,720 |
| 2023 | $924 | $26,920 | $6,200 | $20,720 |
| 2022 | $930 | $26,920 | $6,200 | $20,720 |
| 2021 | $832 | $23,140 | $6,230 | $16,910 |
| 2020 | $832 | $23,140 | $6,230 | $16,910 |
| 2019 | $835 | $23,140 | $6,230 | $16,910 |
| 2018 | $755 | $20,300 | $5,460 | $14,840 |
| 2017 | $756 | $20,300 | $5,460 | $14,840 |
| 2016 | $202 | $5,290 | $5,290 | $0 |
| 2015 | $202 | $5,290 | $5,290 | $0 |
| 2014 | $200 | $5,290 | $5,290 | $0 |
Source: Public Records
Map
Nearby Homes
- 14 N Vine St
- 118 Prospect St
- 135 N Middle St
- 506 Parkview Dr
- 448 Parkview Dr
- 34 Beverly Dr
- 505 Parkview Dr
- 435 N Main St
- 28 Eldon Ct
- 415 Edgewood Dr
- 428 N Elm St
- 1229 Columbiana-Lisbon Rd
- 1229 Columbiana Lisbon Rd Unit 39
- 254 Lucretia Ln Unit Lot 37
- 246 Lucretia Ln Unit Lot 38
- 124 Lucretia Ln Unit Lot 45
- 125 Lucretia Ln Unit Lot 4
- 133 Lucretia Ln Unit Lot 5
- 929 E Park Ave
- 347 Ohio 14
- 229 S Elm St
- 223 S Elm St
- 243 S Elm St
- 241 S Elm St
- 230 S Elm St
- 226 S Elm St
- 245 S Elm St Unit 6
- 245 S Elm St Unit 5
- 245 S Elm St Unit 3
- 245 S Elm St Unit 2
- 245 S Elm St Unit 1
- 21 Pittsburgh St
- 253 S Elm St
- 242 S Elm St
- 220 S Elm St
- 254 S Elm St
- 248 S Elm St
- 1/2 S Elm St
- 239 S Main St
- 223 S Main St