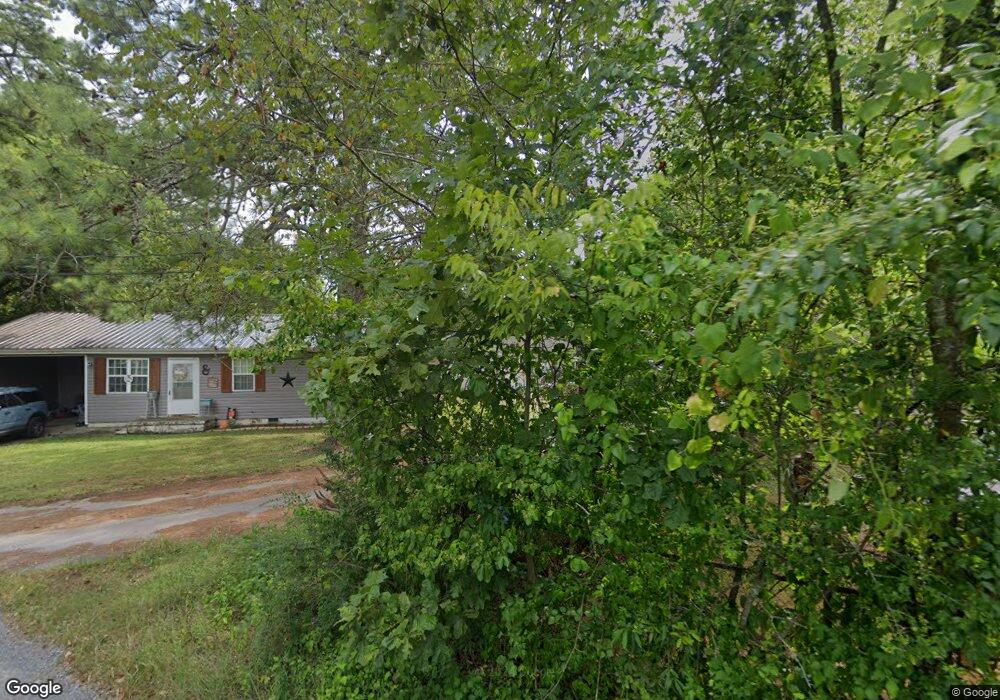
229 Smith St Summerville, GA 30747
Estimated Value: $181,000 - $200,000
4
Beds
2
Baths
1,421
Sq Ft
$135/Sq Ft
Est. Value
About This Home
This home is located at 229 Smith St, Summerville, GA 30747 and is currently estimated at $192,170, approximately $135 per square foot. 229 Smith St is a home located in Chattooga County with nearby schools including Chattooga High School.
Ownership History
Date
Name
Owned For
Owner Type
Purchase Details
Closed on
Jul 7, 2021
Sold by
Sbsc Llc
Bought by
Gianoulis Chris J
Current Estimated Value
Home Financials for this Owner
Home Financials are based on the most recent Mortgage that was taken out on this home.
Original Mortgage
$122,735
Outstanding Balance
$111,465
Interest Rate
2.96%
Mortgage Type
FHA
Estimated Equity
$80,705
Purchase Details
Closed on
Oct 2, 2017
Sold by
Dwayne L
Bought by
Sbsc Llc
Purchase Details
Closed on
Oct 29, 2012
Sold by
Saylor Cody
Bought by
Richardson Dwayne L
Purchase Details
Closed on
Jun 30, 2010
Sold by
Richardson Dwayne L
Bought by
Saylor Cody
Purchase Details
Closed on
Apr 29, 2010
Sold by
Trammell Tracy
Bought by
Richardson Dwayne L
Purchase Details
Closed on
Mar 21, 2007
Sold by
Dana Evelle
Bought by
Milstead Charlotte
Home Financials for this Owner
Home Financials are based on the most recent Mortgage that was taken out on this home.
Original Mortgage
$51,000
Interest Rate
6.18%
Mortgage Type
New Conventional
Create a Home Valuation Report for This Property
The Home Valuation Report is an in-depth analysis detailing your home's value as well as a comparison with similar homes in the area
Home Values in the Area
Average Home Value in this Area
Purchase History
| Date | Buyer | Sale Price | Title Company |
|---|---|---|---|
| Gianoulis Chris J | $125,000 | -- | |
| Sbsc Llc | -- | -- | |
| Richardson Dwayne L | -- | -- | |
| Saylor Cody | $60,000 | -- | |
| Richardson Dwayne L | $10,000 | -- | |
| Richardson Dwayne L | $10,000 | -- | |
| Milstead Charlotte | $51,000 | -- |
Source: Public Records
Mortgage History
| Date | Status | Borrower | Loan Amount |
|---|---|---|---|
| Open | Gianoulis Chris J | $122,735 | |
| Previous Owner | Milstead Charlotte | $51,000 |
Source: Public Records
Tax History Compared to Growth
Tax History
| Year | Tax Paid | Tax Assessment Tax Assessment Total Assessment is a certain percentage of the fair market value that is determined by local assessors to be the total taxable value of land and additions on the property. | Land | Improvement |
|---|---|---|---|---|
| 2024 | $1,288 | $56,680 | $1,440 | $55,240 |
| 2023 | $1,601 | $57,040 | $3,280 | $53,760 |
| 2022 | $1,387 | $49,409 | $1,776 | $47,633 |
| 2021 | $546 | $17,756 | $1,776 | $15,980 |
| 2020 | $569 | $17,756 | $1,776 | $15,980 |
| 2019 | $578 | $17,756 | $1,776 | $15,980 |
| 2018 | $403 | $12,886 | $1,776 | $11,110 |
| 2017 | $420 | $12,886 | $1,776 | $11,110 |
| 2016 | $373 | $12,886 | $1,776 | $11,110 |
| 2015 | -- | $13,048 | $1,776 | $11,272 |
| 2014 | -- | $13,049 | $1,776 | $11,273 |
| 2013 | -- | $13,048 | $1,776 | $11,272 |
Source: Public Records
Map
Nearby Homes
- 102 Oak St
- 0 Hinton St Unit 22750516
- 149 Kirby St
- 190 E Washington St
- 68 Montgomery St
- 103 Highland Ave
- 1509/11 Georgia 100
- 1509/11 Georgia 100 Unit 45-48
- 147 Hill St
- 1330 Georgia 114
- 285 Congress St
- 185 Georgia Ave
- 101 Turner St
- 10117 Commerce St
- 57 N Congress St
- 310 Georgia Ave
- 0 Highway 100 Unit 10392887
- 394 Roseway Cir
- 404 Fourth St
- 412 W First Ave