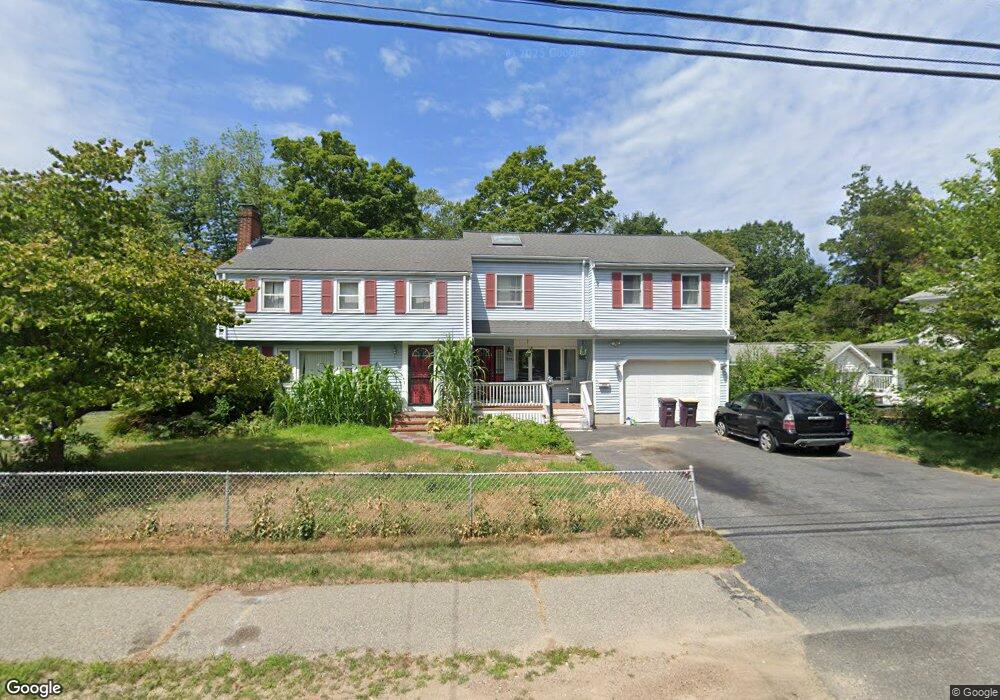
229 Summer St Weymouth, MA 02188
Weymouth Landing NeighborhoodEstimated Value: $814,000 - $858,000
5
Beds
3
Baths
2,808
Sq Ft
$298/Sq Ft
Est. Value
About This Home
This home is located at 229 Summer St, Weymouth, MA 02188 and is currently estimated at $836,946, approximately $298 per square foot. 229 Summer St is a home located in Norfolk County with nearby schools including Frederick C Murphy, Abigail Adams Middle School, and Weymouth Middle School Chapman.
Ownership History
Date
Name
Owned For
Owner Type
Purchase Details
Closed on
Feb 8, 2017
Sold by
Semwayo Chengetai
Bought by
Nofi 3Rd Nicholas and Semwayo Chengetai
Current Estimated Value
Purchase Details
Closed on
Oct 19, 2016
Sold by
Mak Sin T and Mak Lai M
Bought by
Semwayo Chengetai
Home Financials for this Owner
Home Financials are based on the most recent Mortgage that was taken out on this home.
Original Mortgage
$463,980
Interest Rate
4.12%
Mortgage Type
FHA
Create a Home Valuation Report for This Property
The Home Valuation Report is an in-depth analysis detailing your home's value as well as a comparison with similar homes in the area
Home Values in the Area
Average Home Value in this Area
Purchase History
| Date | Buyer | Sale Price | Title Company |
|---|---|---|---|
| Nofi 3Rd Nicholas | -- | -- | |
| Semwayo Chengetai | $480,000 | -- |
Source: Public Records
Mortgage History
| Date | Status | Borrower | Loan Amount |
|---|---|---|---|
| Previous Owner | Semwayo Chengetai | $463,980 |
Source: Public Records
Tax History Compared to Growth
Tax History
| Year | Tax Paid | Tax Assessment Tax Assessment Total Assessment is a certain percentage of the fair market value that is determined by local assessors to be the total taxable value of land and additions on the property. | Land | Improvement |
|---|---|---|---|---|
| 2025 | $7,226 | $715,400 | $217,200 | $498,200 |
| 2024 | $7,000 | $681,600 | $206,900 | $474,700 |
| 2023 | $6,480 | $620,100 | $191,500 | $428,600 |
| 2022 | $6,352 | $554,300 | $177,400 | $376,900 |
| 2021 | $6,470 | $551,100 | $177,400 | $373,700 |
| 2020 | $6,232 | $522,800 | $177,400 | $345,400 |
| 2019 | $6,205 | $512,000 | $170,500 | $341,500 |
| 2018 | $5,988 | $479,000 | $162,400 | $316,600 |
| 2017 | $5,882 | $459,200 | $154,700 | $304,500 |
| 2016 | $5,818 | $454,500 | $148,800 | $305,700 |
| 2015 | $5,568 | $431,600 | $148,800 | $282,800 |
| 2014 | $5,331 | $400,800 | $138,400 | $262,400 |
Source: Public Records
Map
Nearby Homes
- 24 Briarwood Trail
- 5 Judson Rd
- 54 Federal St
- 99 Aster Cir
- 460 Front St
- 33 Congress St
- 15 Summer St
- 11 Thayer Ave
- 21-23 Common St
- 16 Lindbergh Ave
- 23-25 Lindbergh Ave
- 32 Vine St
- 19 Vine St Unit 4
- 114 Broad St Unit C
- 9 Vine St Unit 1
- 11 Richmond St
- 16 Nob Hill Rd
- 25 Richmond St
- 122 Washington St Unit 22
- 28 Webb St