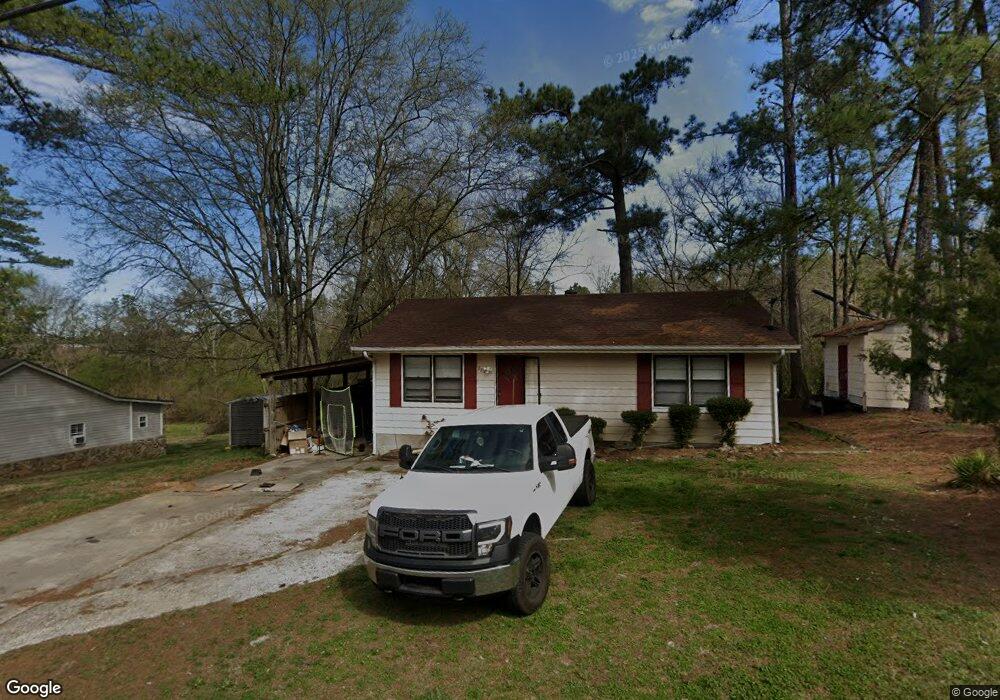
229 Tuck St Cedartown, GA 30125
Estimated Value: $105,000 - $165,000
2
Beds
1
Bath
962
Sq Ft
$140/Sq Ft
Est. Value
About This Home
This home is located at 229 Tuck St, Cedartown, GA 30125 and is currently estimated at $134,279, approximately $139 per square foot. 229 Tuck St is a home located in Polk County with nearby schools including Cedar Christian School.
Ownership History
Date
Name
Owned For
Owner Type
Purchase Details
Closed on
May 19, 2017
Sold by
Johnson Rodney L
Bought by
Hopkins Ashley Nichole
Current Estimated Value
Home Financials for this Owner
Home Financials are based on the most recent Mortgage that was taken out on this home.
Original Mortgage
$43,200
Outstanding Balance
$22,382
Interest Rate
3.97%
Mortgage Type
New Conventional
Estimated Equity
$111,897
Purchase Details
Closed on
Aug 25, 1997
Sold by
Couch Raymond T and Couch Shirley
Bought by
Johnson Rodney L and Johnson Wendy E
Purchase Details
Closed on
Mar 27, 1984
Sold by
Chandley Douglas A
Bought by
Couch Raymond T
Purchase Details
Closed on
Sep 11, 1980
Sold by
Parris Jerry Wayne
Bought by
Chandley Douglas A
Purchase Details
Closed on
Nov 3, 1978
Sold by
Lawrence Charles R
Bought by
Parris Jerry Wayne
Purchase Details
Closed on
Aug 28, 1970
Sold by
Wilson Sue B
Bought by
Lawrence Charles R
Purchase Details
Closed on
Jan 1, 1964
Bought by
Wilson Sue B
Purchase Details
Closed on
Jun 1, 1963
Bought by
Wilson Sue B
Create a Home Valuation Report for This Property
The Home Valuation Report is an in-depth analysis detailing your home's value as well as a comparison with similar homes in the area
Home Values in the Area
Average Home Value in this Area
Purchase History
| Date | Buyer | Sale Price | Title Company |
|---|---|---|---|
| Hopkins Ashley Nichole | $45,000 | -- | |
| Johnson Rodney L | $45,000 | -- | |
| Couch Raymond T | -- | -- | |
| Chandley Douglas A | -- | -- | |
| Parris Jerry Wayne | -- | -- | |
| Lawrence Charles R | -- | -- | |
| Wilson Sue B | -- | -- | |
| Wilson Sue B | -- | -- |
Source: Public Records
Mortgage History
| Date | Status | Borrower | Loan Amount |
|---|---|---|---|
| Open | Hopkins Ashley Nichole | $43,200 |
Source: Public Records
Tax History Compared to Growth
Tax History
| Year | Tax Paid | Tax Assessment Tax Assessment Total Assessment is a certain percentage of the fair market value that is determined by local assessors to be the total taxable value of land and additions on the property. | Land | Improvement |
|---|---|---|---|---|
| 2024 | $1,358 | $42,994 | $4,800 | $38,194 |
| 2023 | $861 | $24,828 | $506 | $24,322 |
| 2022 | $507 | $21,372 | $506 | $20,866 |
| 2021 | $514 | $21,372 | $506 | $20,866 |
| 2020 | $515 | $21,372 | $506 | $20,866 |
| 2019 | $523 | $19,492 | $1,386 | $18,106 |
| 2018 | $496 | $18,758 | $1,188 | $17,570 |
| 2017 | $510 | $18,758 | $1,188 | $17,570 |
| 2016 | $510 | $18,758 | $1,188 | $17,570 |
| 2015 | $512 | $18,758 | $1,188 | $17,570 |
| 2014 | $516 | $18,758 | $1,188 | $17,570 |
Source: Public Records
Map
Nearby Homes
- 203 Cason Rd
- 480 Cason Rd
- 117 Cason Rd
- 205 Pinecrest Rd
- 35 Old Mill Rd
- 149 Irwin St
- 0 Philpot Springs Unit 10626665
- 766 Antioch Rd
- 1987 Buchanan Hwy
- 129 W Ellawood Ave
- 151 W Ellawood Ave
- 255 Mildred Dr
- 325 Fairview Ave
- 1003 Fairview Ave
- 234 Brooks St
- 00 Juliette St
- 00 Buchanan Hwy
- 729 S College St
- 634 Georgia Ave
- 634 Georgia Ave Unit 123