229 Vaughn Rd Hudson Falls, NY 12839
Estimated Value: $181,092
2
Beds
1
Bath
1,520
Sq Ft
$119/Sq Ft
Est. Value
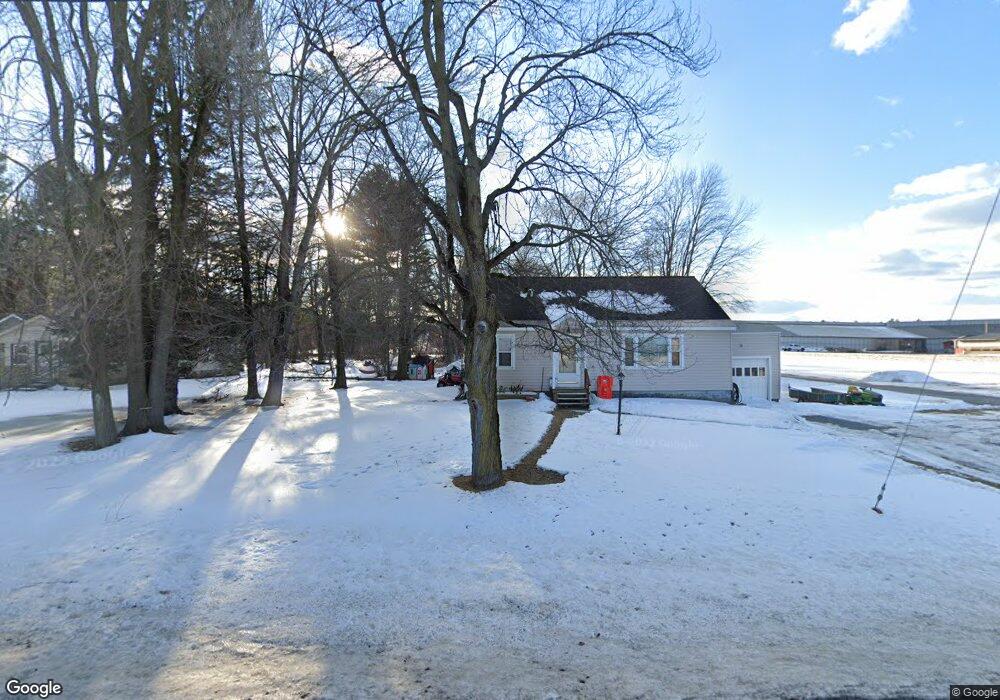
About This Home
This home is located at 229 Vaughn Rd, Hudson Falls, NY 12839 and is currently estimated at $181,092, approximately $119 per square foot. 229 Vaughn Rd is a home located in Washington County with nearby schools including Margaret Murphy Kindergarten Center, Hudson Falls Primary School, and Hudson Falls Intermediate School.
Ownership History
Date
Name
Owned For
Owner Type
Purchase Details
Closed on
Jan 26, 2024
Sold by
Ideal Dairy Farms Inc
Bought by
Ideal Dairy Llc
Current Estimated Value
Purchase Details
Closed on
Jan 19, 2016
Sold by
Underwood Irrevocable Trust Dorothy J
Bought by
Ideal Dairy Farms Inc
Purchase Details
Closed on
Oct 17, 2013
Sold by
Underwood Dorothy J
Bought by
Underwood Wayne
Create a Home Valuation Report for This Property
The Home Valuation Report is an in-depth analysis detailing your home's value as well as a comparison with similar homes in the area
Home Values in the Area
Average Home Value in this Area
Purchase History
| Date | Buyer | Sale Price | Title Company |
|---|---|---|---|
| Ideal Dairy Llc | -- | None Available | |
| Ideal Dairy Llc | -- | None Available | |
| Ideal Dairy Farms Inc | $100,000 | Mary Ellen Stockwell | |
| Ideal Dairy Farms Inc | $100,000 | Mary Ellen Stockwell | |
| Underwood Wayne | -- | David C. Klingebiel | |
| Underwood Wayne | -- | David C. Klingebiel |
Source: Public Records
Tax History Compared to Growth
Tax History
| Year | Tax Paid | Tax Assessment Tax Assessment Total Assessment is a certain percentage of the fair market value that is determined by local assessors to be the total taxable value of land and additions on the property. | Land | Improvement |
|---|---|---|---|---|
| 2024 | $383 | $58,300 | $58,300 | $0 |
| 2023 | $953 | $58,300 | $58,300 | $0 |
| 2022 | $1,615 | $55,000 | $55,000 | $0 |
| 2021 | $2,349 | $110,000 | $47,000 | $63,000 |
| 2020 | $2,321 | $110,000 | $47,000 | $63,000 |
| 2019 | $2,112 | $110,000 | $47,000 | $63,000 |
| 2018 | $2,112 | $100,000 | $47,000 | $53,000 |
| 2017 | $2,117 | $100,000 | $47,000 | $53,000 |
| 2016 | $3,598 | $122,500 | $47,000 | $75,500 |
| 2014 | -- | $121,300 | $47,000 | $74,300 |
Source: Public Records
Map
Nearby Homes