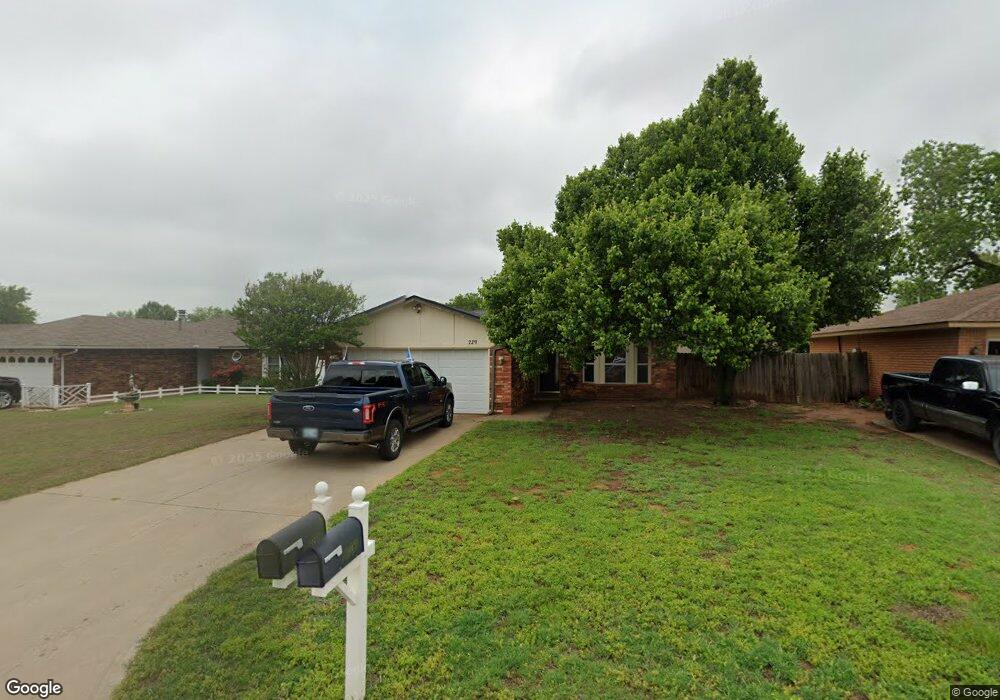
229 W Chantilly Way Mustang, OK 73064
Estimated Value: $185,141 - $193,000
3
Beds
2
Baths
1,228
Sq Ft
$155/Sq Ft
Est. Value
About This Home
This home is located at 229 W Chantilly Way, Mustang, OK 73064 and is currently estimated at $190,035, approximately $154 per square foot. 229 W Chantilly Way is a home located in Canadian County with nearby schools including Mustang Centennial Elementary School, Mustang Horizon Intermediate School, and Mustang Middle School.
Ownership History
Date
Name
Owned For
Owner Type
Purchase Details
Closed on
Apr 28, 2017
Sold by
Steiner Elliot and Steiner Kishia
Bought by
Steiner David E and Steiner Quannah J
Current Estimated Value
Purchase Details
Closed on
Aug 26, 2011
Sold by
Ballew Matthew and Ballew Laura
Bought by
Steiner Elliot
Home Financials for this Owner
Home Financials are based on the most recent Mortgage that was taken out on this home.
Original Mortgage
$91,809
Interest Rate
3.75%
Mortgage Type
FHA
Purchase Details
Closed on
May 18, 2007
Sold by
Adcock Tracy E and Fike Tracy E
Bought by
Ballew Matthew and Ballew Laura
Home Financials for this Owner
Home Financials are based on the most recent Mortgage that was taken out on this home.
Original Mortgage
$97,000
Interest Rate
6.22%
Mortgage Type
New Conventional
Purchase Details
Closed on
Nov 25, 1998
Sold by
Wilson Steven R and Wilson Karen L
Purchase Details
Closed on
Apr 1, 1987
Create a Home Valuation Report for This Property
The Home Valuation Report is an in-depth analysis detailing your home's value as well as a comparison with similar homes in the area
Home Values in the Area
Average Home Value in this Area
Purchase History
| Date | Buyer | Sale Price | Title Company |
|---|---|---|---|
| Steiner David E | $104,000 | Old Republic Title | |
| Steiner Elliot | $101,000 | Ort | |
| Ballew Matthew | $72,750 | None Available | |
| -- | $66,500 | -- | |
| -- | -- | -- |
Source: Public Records
Mortgage History
| Date | Status | Borrower | Loan Amount |
|---|---|---|---|
| Previous Owner | Steiner Elliot | $91,809 | |
| Previous Owner | Ballew Matthew | $97,000 |
Source: Public Records
Tax History Compared to Growth
Tax History
| Year | Tax Paid | Tax Assessment Tax Assessment Total Assessment is a certain percentage of the fair market value that is determined by local assessors to be the total taxable value of land and additions on the property. | Land | Improvement |
|---|---|---|---|---|
| 2024 | $1,484 | $15,620 | $1,800 | $13,820 |
| 2023 | $1,484 | $14,876 | $1,800 | $13,076 |
| 2022 | $1,431 | $14,168 | $1,800 | $12,368 |
| 2021 | $1,368 | $13,493 | $1,800 | $11,693 |
| 2020 | $1,311 | $12,851 | $1,800 | $11,051 |
| 2019 | $1,291 | $12,659 | $1,800 | $10,859 |
| 2018 | $1,257 | $12,056 | $1,800 | $10,256 |
| 2017 | $1,021 | $10,909 | $1,800 | $9,109 |
| 2016 | $990 | $10,778 | $1,800 | $8,978 |
| 2015 | $1,139 | $10,283 | $1,800 | $8,483 |
| 2014 | $1,139 | $11,973 | $1,440 | $10,533 |
Source: Public Records
Map
Nearby Homes
- 606 N Pine Branch Way
- 237 W Pines Way
- 413 W Pines Way
- 0 N Mustang Rd
- 0 N Mustang Rd
- 14842 SW 74th St
- 14900 SW 74th St
- 504 N Russell Terrace
- 531 W Shadow Ridge Way
- 3636 Blue Ave
- 3629 Blue Ave
- 3633 Blue Ave
- 3637 Pete St
- 3633 Pete St
- 3632 Blue Ave
- 628 W Alamo Court Way
- 350 W Elder Dr
- 602 W Shadow Ridge Way
- 1109 N Charlotte Terrace
- 601 N Chisholm Trail Way
- 233 W Chantilly Way
- 225 W Chantilly Way
- 237 W Chantilly Way
- 221 W Chantilly Way
- 226 W Maple Branch Way
- 236 W Maple Branch Way
- 242 W Maple Branch Way
- 230 W Chantilly Way
- 241 W Chantilly Way
- 234 W Chantilly Way
- 226 W Chantilly Way
- 222 W Maple Branch Way
- 217 W Chantilly Way
- 238 W Chantilly Way
- 248 W Maple Branch Way
- 222 W Chantilly Way
- 245 W Chantilly Way
- 242 W Chantilly Way
- 218 W Maple Branch Way
- 252 W Maple Branch Way