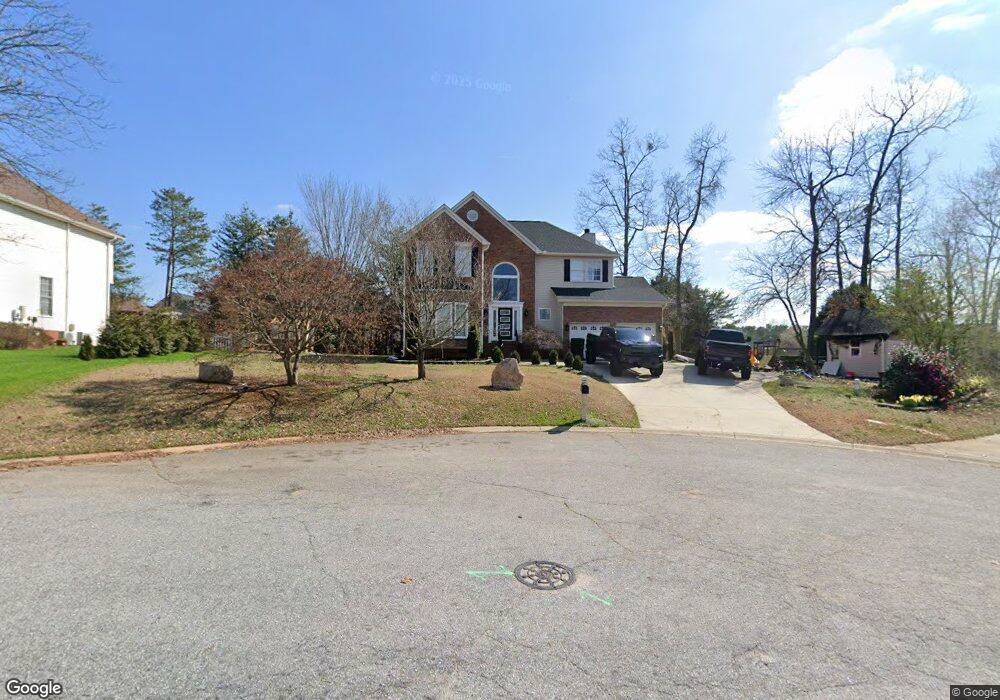
229 W Poplar Ridge Dr Duncan, SC 29334
Estimated Value: $324,000 - $345,023
4
Beds
3
Baths
2,417
Sq Ft
$139/Sq Ft
Est. Value
About This Home
This home is located at 229 W Poplar Ridge Dr, Duncan, SC 29334 and is currently estimated at $334,756, approximately $138 per square foot. 229 W Poplar Ridge Dr is a home located in Spartanburg County with nearby schools including Florence Chapel Middle School, Berry Shoals Intermediate School, and Byrnes Freshman Academy.
Ownership History
Date
Name
Owned For
Owner Type
Purchase Details
Closed on
Sep 18, 2025
Sold by
Lozko Nikolay
Bought by
Lozko Nikolay and Lozko Lacey
Current Estimated Value
Purchase Details
Closed on
Dec 14, 2012
Sold by
Willow Oaks Associates Of Cowpens
Bought by
Edgewater Foster Street Lp
Purchase Details
Closed on
Nov 21, 2012
Sold by
United States Department Of Housing & Ur
Bought by
Lozko Nikolay
Purchase Details
Closed on
Jun 13, 2012
Sold by
Wells Fargo Bank Na
Bought by
Secretary Of Housing & Urban Development
Purchase Details
Closed on
Apr 18, 2012
Sold by
Ray Jamie S
Bought by
Wells Fargo Bank Na
Purchase Details
Closed on
Mar 13, 2008
Sold by
Cai Yaruan and Wang Ling Ming
Bought by
Ray Jamie S and Ray Heather P
Home Financials for this Owner
Home Financials are based on the most recent Mortgage that was taken out on this home.
Original Mortgage
$186,572
Interest Rate
5.68%
Mortgage Type
FHA
Create a Home Valuation Report for This Property
The Home Valuation Report is an in-depth analysis detailing your home's value as well as a comparison with similar homes in the area
Home Values in the Area
Average Home Value in this Area
Purchase History
| Date | Buyer | Sale Price | Title Company |
|---|---|---|---|
| Lozko Nikolay | -- | None Listed On Document | |
| Edgewater Foster Street Lp | $392,395 | -- | |
| Lozko Nikolay | $122,600 | -- | |
| Secretary Of Housing & Urban Development | -- | -- | |
| Wells Fargo Bank Na | $2,500 | -- | |
| Ray Jamie S | $189,500 | None Available |
Source: Public Records
Mortgage History
| Date | Status | Borrower | Loan Amount |
|---|---|---|---|
| Previous Owner | Ray Jamie S | $186,572 |
Source: Public Records
Tax History Compared to Growth
Tax History
| Year | Tax Paid | Tax Assessment Tax Assessment Total Assessment is a certain percentage of the fair market value that is determined by local assessors to be the total taxable value of land and additions on the property. | Land | Improvement |
|---|---|---|---|---|
| 2025 | $1,410 | $9,479 | $1,456 | $8,023 |
| 2024 | $1,410 | $9,479 | $1,456 | $8,023 |
| 2023 | $1,410 | $9,479 | $1,456 | $8,023 |
| 2022 | $1,277 | $8,243 | $1,108 | $7,135 |
| 2021 | $1,277 | $8,243 | $1,108 | $7,135 |
| 2020 | $1,253 | $8,243 | $1,108 | $7,135 |
| 2019 | $1,249 | $8,243 | $1,108 | $7,135 |
| 2018 | $1,190 | $8,243 | $1,108 | $7,135 |
| 2017 | $1,026 | $7,168 | $920 | $6,248 |
| 2016 | $987 | $7,168 | $920 | $6,248 |
| 2015 | $968 | $7,168 | $920 | $6,248 |
| 2014 | $971 | $7,168 | $920 | $6,248 |
Source: Public Records
Map
Nearby Homes
- 402 Rolling Pines Ln
- 734 Terrace Creek Dr
- 701 Terrace Creek Dr
- 717 Terrace Creek Dr
- 756 Windward Ln
- 104 W Stableford Dr
- 267 Santa Ana Way
- 406 S Lakeview Dr
- 802 Morning Fog Dr
- 650 Windward Ln
- 750 Charleston Place
- 431 Whispering Ridge Trail
- 159 Santa Ana Way
- 131 Santa Ana Way
- 372 Old South Rd
- 147 Bearden Dr
- 749 W Tara Ln
- 113 Commodore Dr
- 251 River Falls Dr
- 1008 Zinfandel Way
- 195 Timberleaf Dr
- 233 W Poplar Ridge Dr
- 225 W Poplar Ridge Dr
- 201 Timberleaf Dr
- 195 Timberleaf Dr
- 232 W Poplar Ridge Dr
- 179 Timberleaf Dr
- 205 Timberleaf Dr
- 228 W Poplar Ridge Dr
- 221 W Poplar Ridge Dr
- 224 W Poplar Ridge Dr
- 169 Timberleaf Dr
- 161 Timberleaf Dr
- 209 Timberleaf Dr
- 157 Timberleaf Dr
- 220 W Poplar Ridge Dr
- 153 Timberleaf Dr
- 217 W Poplar Ridge Dr
- 145 Timberleaf Dr
- 149 Timberleaf Dr