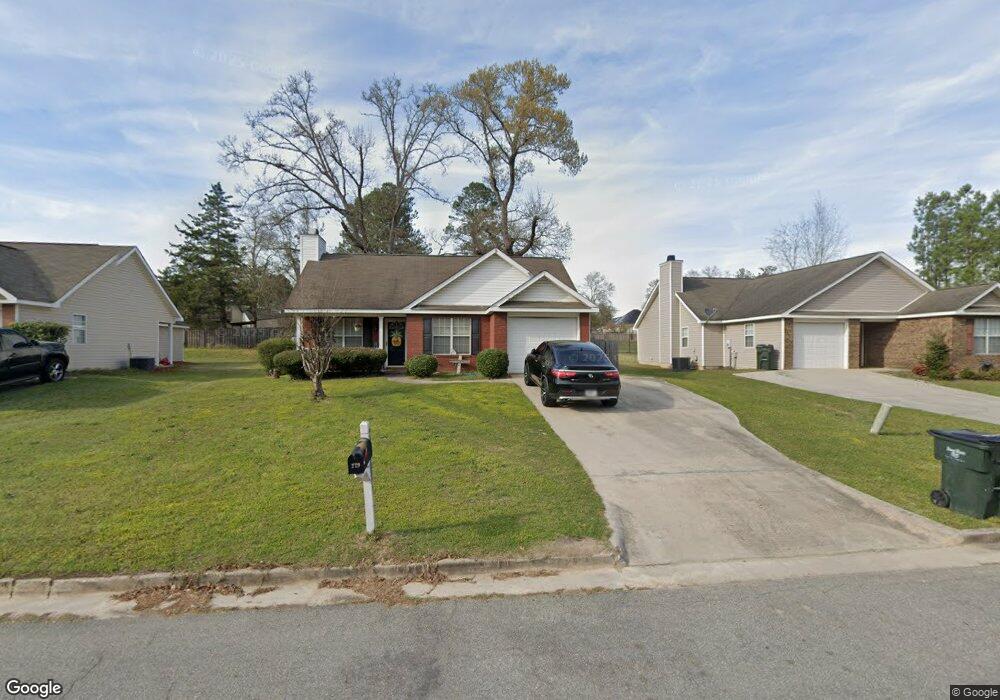
229 Willis Creek Rd Warner Robins, GA 31088
Estimated Value: $183,100 - $207,000
3
Beds
3
Baths
1,331
Sq Ft
$149/Sq Ft
Est. Value
About This Home
This home is located at 229 Willis Creek Rd, Warner Robins, GA 31088 and is currently estimated at $198,775, approximately $149 per square foot. 229 Willis Creek Rd is a home located in Houston County with nearby schools including Shirley Hills Elementary School, Warner Robins Middle School, and Warner Robins High School.
Ownership History
Date
Name
Owned For
Owner Type
Purchase Details
Closed on
Feb 28, 2006
Sold by
Cole Ronald D
Bought by
Deloach Erica Z
Current Estimated Value
Home Financials for this Owner
Home Financials are based on the most recent Mortgage that was taken out on this home.
Original Mortgage
$106,954
Outstanding Balance
$60,017
Interest Rate
6.05%
Mortgage Type
FHA
Estimated Equity
$138,758
Purchase Details
Closed on
Mar 15, 2005
Sold by
Brown Tammy Fitzgerald
Bought by
Cole Ronald D
Home Financials for this Owner
Home Financials are based on the most recent Mortgage that was taken out on this home.
Original Mortgage
$95,510
Interest Rate
5.6%
Mortgage Type
VA
Purchase Details
Closed on
Oct 12, 2001
Sold by
Fann Construction Llc
Bought by
Fitzgerald Tammy
Purchase Details
Closed on
Mar 6, 2001
Sold by
Willis Creek Llc
Bought by
Fann Construction Llc
Create a Home Valuation Report for This Property
The Home Valuation Report is an in-depth analysis detailing your home's value as well as a comparison with similar homes in the area
Home Values in the Area
Average Home Value in this Area
Purchase History
| Date | Buyer | Sale Price | Title Company |
|---|---|---|---|
| Deloach Erica Z | $107,500 | None Available | |
| Cole Ronald D | -- | None Available | |
| Cole Ronald D | $93,500 | None Available | |
| Fitzgerald Tammy | $76,000 | -- | |
| Fann Construction Llc | $14,500 | -- |
Source: Public Records
Mortgage History
| Date | Status | Borrower | Loan Amount |
|---|---|---|---|
| Open | Cole Ronald D | $106,954 | |
| Previous Owner | Cole Ronald D | $95,510 |
Source: Public Records
Tax History Compared to Growth
Tax History
| Year | Tax Paid | Tax Assessment Tax Assessment Total Assessment is a certain percentage of the fair market value that is determined by local assessors to be the total taxable value of land and additions on the property. | Land | Improvement |
|---|---|---|---|---|
| 2024 | $2,150 | $67,080 | $6,000 | $61,080 |
| 2023 | $1,938 | $60,160 | $6,000 | $54,160 |
| 2022 | $1,121 | $50,760 | $6,000 | $44,760 |
| 2021 | $1,007 | $45,560 | $6,000 | $39,560 |
| 2020 | $854 | $38,760 | $6,000 | $32,760 |
| 2019 | $854 | $38,760 | $6,000 | $32,760 |
| 2018 | $854 | $38,760 | $6,000 | $32,760 |
| 2017 | $855 | $38,760 | $6,000 | $32,760 |
| 2016 | $856 | $38,760 | $6,000 | $32,760 |
| 2015 | -- | $38,760 | $6,000 | $32,760 |
| 2014 | $387 | $38,760 | $6,000 | $32,760 |
| 2013 | $387 | $38,760 | $6,000 | $32,760 |
Source: Public Records
Map
Nearby Homes
- 213 Buckskin Dr
- 116 Elk Run
- 104 Alton Woods Dr
- 616 Woods Edge Way
- 103 Sandy Valley Dr
- 209 Mossy Ridge
- 302 Creek Ridge Dr
- 230 Tucker Rd
- 306 Thornwood Dr
- 121 Chadwyck Cir
- 203 Lattice Bend
- 201 Bayside Dr
- 102 Meadow Ct
- 25 & 26 Lot
- 118 Fox Glove Ct
- 119 Fox Glove Ct
- 107 Melody Ln
- 99 Bass Rd
- 401 Feagin Mill Rd
- 1027 Kathryn Ryals Rd
- 227 Willis Creek Rd
- 231 Willis Creek Rd
- 225 Willis Creek Rd
- 204 Cade Terrace
- 228 Willis Creek Rd
- 230 Willis Creek Rd
- 226 Willis Creek Rd
- 223 Willis Creek Rd
- 232 Willis Creek Rd
- 234 Willis Creek Rd
- 206 Cade Terrace
- 221 Willis Creek Rd
- 202 Cade Terrace
- 222 Willis Creek Rd
- 202 Cade Terrace (Lot 14)
- 238 Willis Creek Rd
- 236 Willis Creek Rd
- 220 Willis Creek Rd
- 219 Willis Creek Rd
- 203 Cade Terrace