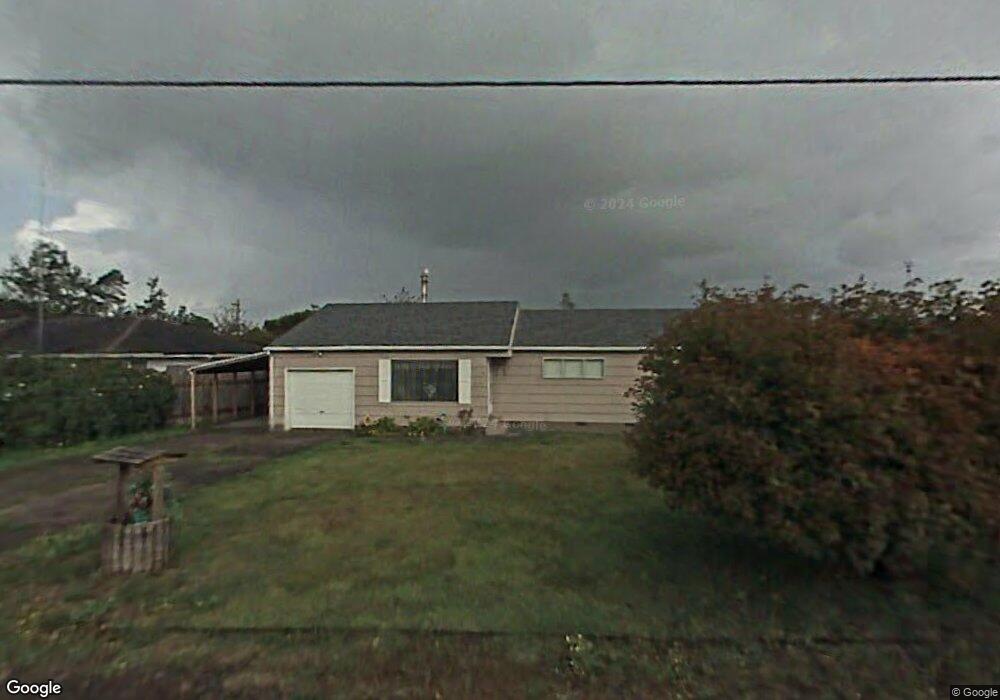
2290 Nielsen Rd Tillamook, OR 97141
Estimated Value: $337,686 - $421,000
3
Beds
2
Baths
1,452
Sq Ft
$257/Sq Ft
Est. Value
About This Home
This home is located at 2290 Nielsen Rd, Tillamook, OR 97141 and is currently estimated at $373,422, approximately $257 per square foot. 2290 Nielsen Rd is a home located in Tillamook County with nearby schools including Tillamook High School, Little Clipper Preschool, and Tillamook Adventist School.
Ownership History
Date
Name
Owned For
Owner Type
Purchase Details
Closed on
Apr 26, 2017
Sold by
Rodriguez Jose Orozco
Bought by
Benito Luis G and Orozco Alexis
Current Estimated Value
Home Financials for this Owner
Home Financials are based on the most recent Mortgage that was taken out on this home.
Original Mortgage
$176,739
Outstanding Balance
$147,369
Interest Rate
4.37%
Mortgage Type
FHA
Estimated Equity
$226,053
Purchase Details
Closed on
Aug 10, 2009
Sold by
Birdsong Kevin and Birdsong Charlotte
Bought by
Rodriguez Jose Orozco
Home Financials for this Owner
Home Financials are based on the most recent Mortgage that was taken out on this home.
Original Mortgage
$158,163
Interest Rate
5.3%
Mortgage Type
Purchase Money Mortgage
Purchase Details
Closed on
Mar 31, 2005
Sold by
Rodriguez Salu F and Rodriguez Barbara E
Bought by
Birdsong Kevin and Birdsong Charlotte
Create a Home Valuation Report for This Property
The Home Valuation Report is an in-depth analysis detailing your home's value as well as a comparison with similar homes in the area
Home Values in the Area
Average Home Value in this Area
Purchase History
| Date | Buyer | Sale Price | Title Company |
|---|---|---|---|
| Benito Luis G | $180,000 | Ticor Title Company Of Or | |
| Rodriguez Jose Orozco | $155,000 | Ticor Title Insurance | |
| Birdsong Kevin | $110,000 | Ticor Title Ins Co |
Source: Public Records
Mortgage History
| Date | Status | Borrower | Loan Amount |
|---|---|---|---|
| Open | Benito Luis G | $176,739 | |
| Previous Owner | Rodriguez Jose Orozco | $158,163 |
Source: Public Records
Tax History Compared to Growth
Tax History
| Year | Tax Paid | Tax Assessment Tax Assessment Total Assessment is a certain percentage of the fair market value that is determined by local assessors to be the total taxable value of land and additions on the property. | Land | Improvement |
|---|---|---|---|---|
| 2024 | $1,211 | $118,780 | $54,020 | $64,760 |
| 2023 | $1,205 | $115,330 | $52,450 | $62,880 |
| 2022 | $1,163 | $111,980 | $50,920 | $61,060 |
| 2021 | $1,130 | $108,720 | $49,440 | $59,280 |
| 2020 | $1,100 | $105,560 | $48,000 | $57,560 |
| 2019 | $1,073 | $102,490 | $46,600 | $55,890 |
| 2018 | $1,047 | $99,510 | $45,240 | $54,270 |
| 2017 | $1,022 | $96,620 | $43,920 | $52,700 |
| 2016 | $983 | $93,810 | $42,640 | $51,170 |
| 2015 | $965 | $91,080 | $41,400 | $49,680 |
| 2014 | $951 | $88,430 | $40,190 | $48,240 |
| 2013 | -- | $85,860 | $39,020 | $46,840 |
Source: Public Records
Map
Nearby Homes
- 17805 U S 101 S
- 02600 12th St
- Lot 2405 12th St
- 1010 Ivy Ave
- TL#02600 12th St
- 2105 9th St
- 0 12th St Unit 2405
- 1003 Grove Ave
- 1009/1011 Grove Ave Unit 1009-11
- 2305 7th St
- 1806 8th St
- 903 Evergreen Dr
- 1412 9th St
- 1706 5th St
- 2410 3rd St
- 00201 Wilson River Hwy
- TL# 02100 Wilson River Hwy
- Parcel 1 Wilson River Hwy
- Parcel 2 Wilson River Hwy
- 500 etc. Wilson River Hwy
- 2310 Nielsen Rd
- 2270 Nielsen Rd
- 2305 Swett Acres Rd
- 2275 Swett Acres Rd
- 2250 Nielsen Rd
- 2330 Nielsen Rd
- 2255 Swett Acres Rd
- 2230 Nielsen Rd
- 2235 Swett Acres Rd
- 2215 Swett Acres Rd
- 2210 Nielsen Rd
- 2205 Swett Acres Rd
- 2390 Nielsen Rd
- 2185 Swett Acres Rd
- 2180 Nielsen Rd
- 2170 Nielsen Rd
- 2120 Nielsen Rd
- 2450 Nielsen Rd
- V/L #01403 Tillamook River Rd
- 2110 Nielsen Rd