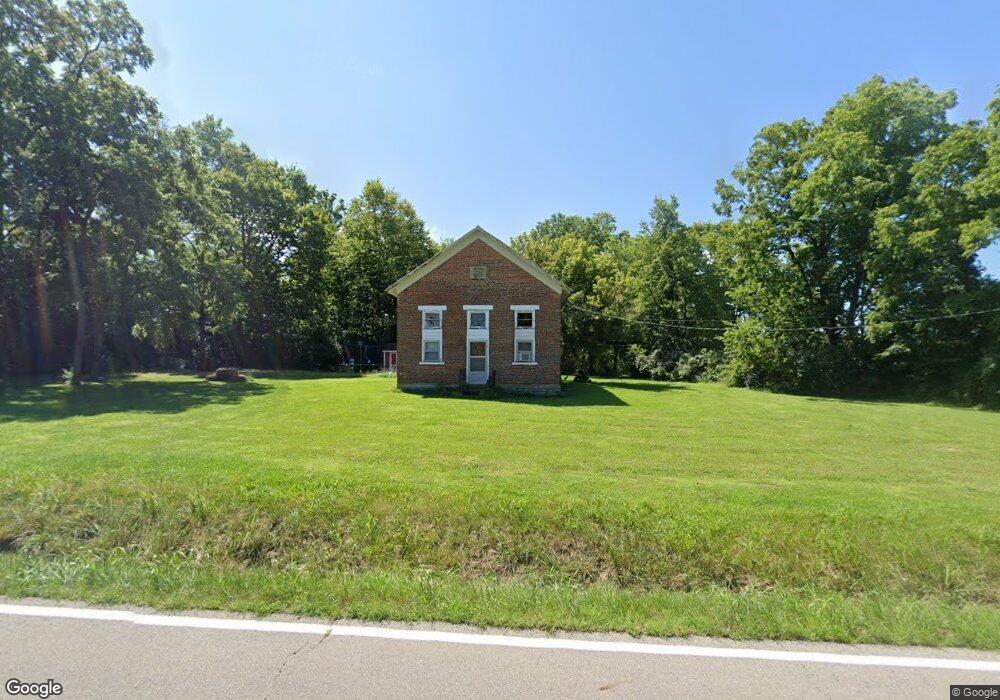
2291 Scott Rd Oxford, OH 45056
Estimated Value: $124,000 - $252,000
2
Beds
1
Bath
850
Sq Ft
$213/Sq Ft
Est. Value
About This Home
This home is located at 2291 Scott Rd, Oxford, OH 45056 and is currently estimated at $181,197, approximately $213 per square foot. 2291 Scott Rd is a home located in Butler County with nearby schools including Talawanda Middle School and Talawanda High School.
Ownership History
Date
Name
Owned For
Owner Type
Purchase Details
Closed on
Dec 10, 2025
Sold by
Dwight R Harris Trust and Harris James Brodbelt
Bought by
Harris James B
Current Estimated Value
Purchase Details
Closed on
Nov 20, 2025
Sold by
Dwight R Harris Trust and Harris James Brodbelt
Bought by
Dwight R Harris Trust and Harris
Purchase Details
Closed on
May 2, 2016
Sold by
Harris James Brodbelt Succ Tr Etal
Bought by
James Brodbelt Harris Tr and Of The D
Home Financials for this Owner
Home Financials are based on the most recent Mortgage that was taken out on this home.
Interest Rate
3.66%
Purchase Details
Closed on
Dec 30, 2015
Sold by
Harris James Brodbelt and Richard Harris D
Bought by
Harris James Brodbelt and Dwight R Harris Trust
Purchase Details
Closed on
Apr 10, 2010
Sold by
Harris Dwight R
Bought by
Harris Dwight R
Purchase Details
Closed on
Jan 27, 2010
Sold by
Estate Of Norma Jean Brodbelt Harris
Bought by
Harris Dwight R and Trust Created By Norma Jean Harris
Purchase Details
Closed on
Mar 30, 2009
Sold by
Harris Dwight R
Bought by
Harris Norma Jean Brodbelt
Create a Home Valuation Report for This Property
The Home Valuation Report is an in-depth analysis detailing your home's value as well as a comparison with similar homes in the area
Home Values in the Area
Average Home Value in this Area
Purchase History
| Date | Buyer | Sale Price | Title Company |
|---|---|---|---|
| Harris James B | -- | None Listed On Document | |
| Dwight R Harris Trust | -- | None Listed On Document | |
| James Brodbelt Harris Tr | -- | -- | |
| Harris James Brodbelt | -- | None Available | |
| Harris James Brodbelt | -- | None Available | |
| Harris Dwight R | -- | None Available | |
| Harris Dwight R | -- | None Available | |
| Harris Norma Jean Brodbelt | -- | None Available |
Source: Public Records
Mortgage History
| Date | Status | Borrower | Loan Amount |
|---|---|---|---|
| Previous Owner | James Brodbelt Harris Tr | -- |
Source: Public Records
Tax History
| Year | Tax Paid | Tax Assessment Tax Assessment Total Assessment is a certain percentage of the fair market value that is determined by local assessors to be the total taxable value of land and additions on the property. | Land | Improvement |
|---|---|---|---|---|
| 2025 | $1,334 | $36,380 | $13,300 | $23,080 |
| 2024 | $1,334 | $36,380 | $13,300 | $23,080 |
| 2023 | $1,327 | $36,380 | $13,300 | $23,080 |
| 2022 | $1,132 | $27,870 | $13,300 | $14,570 |
| 2021 | $1,079 | $27,870 | $13,300 | $14,570 |
| 2020 | $1,127 | $27,870 | $13,300 | $14,570 |
| 2019 | $1,893 | $24,230 | $13,300 | $10,930 |
| 2018 | $1,031 | $24,230 | $13,300 | $10,930 |
| 2017 | $961 | $24,230 | $13,300 | $10,930 |
| 2016 | $928 | $22,640 | $13,300 | $9,340 |
| 2015 | $944 | $22,640 | $13,300 | $9,340 |
| 2014 | $617 | $22,640 | $13,300 | $9,340 |
| 2013 | $617 | $29,050 | $13,300 | $15,750 |
Source: Public Records
Map
Nearby Homes
- 4203 Darr Dr
- 1950 W Taylor School Rd
- 1759 Oxford Trenton Rd
- 4280 West St
- 3285 Hamilton Richmond Rd
- 4025 Darrtown Rd
- 0 Harris Rd Unit 1867558
- 1614 Hogue Rd
- C Hamilton Richmond Rd
- B Hamilton Richmond Rd
- 2136 Stillwell Beckett Rd
- 712 W Taylor School Rd
- 3849 Nichols Rd
- 1750 Stillwell Beckett Rd
- 2464 Oxford Middletown Rd
- 3009 Lanes Mill Rd
- 3550 Oxford-Middletown
- 2114 Vizedom Rd
- 1325 Pineview Ct
- 2857 Pine Leaf Ct
- 11.330ac Scott Rd
- 2 Scott Rd Unit 2
- 1 Scott Rd Unit 1
- 3 Scott Rd Unit 3
- 1506 Scott Rd
- 0 Scott Rd Unit 3 1242199
- 0 Scott Rd Unit 1307392
- 0 Scott Rd Unit 1441910
- 0 Scott Rd Unit 1513813
- 0 Scott Rd Unit 1725215
- 2391 Scott Rd
- 1801 Scott Rd
- 1840 Scott Rd
- 2420 Scott Rd
- 2421 Scott Rd
- 1799 Scott Rd
- 2536 Scott Rd
- 2606 Scott Rd
- 2585 Scott Rd
- 2611 Scott Rd
Your Personal Tour Guide
Ask me questions while you tour the home.