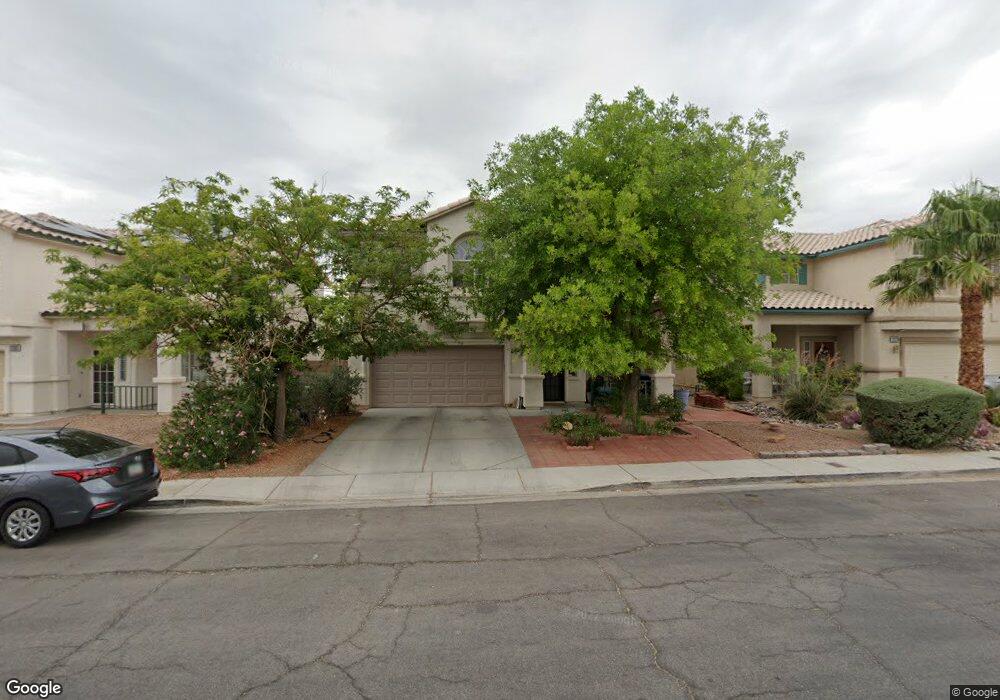
2291 Tulip Field St Las Vegas, NV 89142
Estimated Value: $479,000 - $506,000
4
Beds
3
Baths
2,368
Sq Ft
$206/Sq Ft
Est. Value
About This Home
This home is located at 2291 Tulip Field St, Las Vegas, NV 89142 and is currently estimated at $487,975, approximately $206 per square foot. 2291 Tulip Field St is a home located in Clark County with nearby schools including Dan Goldfarb Elementary School, Kathleen & Tim Harney Middle School, and Las Vegas High School.
Ownership History
Date
Name
Owned For
Owner Type
Purchase Details
Closed on
Nov 23, 2016
Sold by
Burningham Andrew G and Burningham Andrew Gordon
Bought by
Burningham Andrew G
Current Estimated Value
Purchase Details
Closed on
Nov 21, 2016
Sold by
Burningham Andrew G and Burningham Andrew Gordon
Bought by
Burningham Andrew G and The Burningham Revocable Living Trust
Purchase Details
Closed on
Oct 6, 2016
Sold by
Andrew Brunin Gham
Bought by
Burningul Andrew G
Purchase Details
Closed on
Aug 17, 2011
Sold by
Burningham Andrew G
Bought by
Burningham Andrew G and Rochelle Burningham G
Purchase Details
Closed on
Dec 15, 2000
Sold by
Burningham Carla R
Bought by
Burningham Andrew G
Home Financials for this Owner
Home Financials are based on the most recent Mortgage that was taken out on this home.
Original Mortgage
$144,000
Interest Rate
7.81%
Purchase Details
Closed on
May 14, 1997
Sold by
Lewis Properties
Bought by
Burningham Andrew G and Burningham Carla R
Home Financials for this Owner
Home Financials are based on the most recent Mortgage that was taken out on this home.
Original Mortgage
$140,847
Interest Rate
8.15%
Mortgage Type
VA
Create a Home Valuation Report for This Property
The Home Valuation Report is an in-depth analysis detailing your home's value as well as a comparison with similar homes in the area
Home Values in the Area
Average Home Value in this Area
Purchase History
| Date | Buyer | Sale Price | Title Company |
|---|---|---|---|
| Burningham Andrew G | -- | None Available | |
| Burningham Andrew G | -- | None Available | |
| Burningul Andrew G | -- | None Available | |
| Burningham Andrew G | -- | None Available | |
| Burningham Andrew G | -- | First American Title Co | |
| Burningham Andrew G | $138,500 | United Title |
Source: Public Records
Mortgage History
| Date | Status | Borrower | Loan Amount |
|---|---|---|---|
| Previous Owner | Burningham Andrew G | $144,000 | |
| Previous Owner | Burningham Andrew G | $140,847 |
Source: Public Records
Tax History Compared to Growth
Tax History
| Year | Tax Paid | Tax Assessment Tax Assessment Total Assessment is a certain percentage of the fair market value that is determined by local assessors to be the total taxable value of land and additions on the property. | Land | Improvement |
|---|---|---|---|---|
| 2025 | $1,612 | $112,670 | $24,850 | $87,820 |
| 2024 | $1,565 | $112,670 | $24,850 | $87,820 |
| 2023 | $1,565 | $111,761 | $28,700 | $83,061 |
| 2022 | $1,525 | $99,851 | $23,450 | $76,401 |
| 2021 | $1,482 | $93,912 | $21,350 | $72,562 |
| 2020 | $1,435 | $92,737 | $20,650 | $72,087 |
| 2019 | $1,419 | $89,147 | $17,850 | $71,297 |
| 2018 | $1,353 | $83,043 | $14,700 | $68,343 |
| 2017 | $2,426 | $82,725 | $13,300 | $69,425 |
| 2016 | $1,265 | $70,120 | $9,450 | $60,670 |
| 2015 | $1,263 | $57,108 | $8,050 | $49,058 |
| 2014 | $1,226 | $46,148 | $7,000 | $39,148 |
Source: Public Records
Map
Nearby Homes
- 2316 Tulip Field St
- 6260 Peach Orchard Rd
- 6233 Apple Orchard Dr
- 6275 Allspice Ct
- 6170 E Sahara Ave Unit 1031
- 6170 E Sahara Ave Unit 1076
- 6131 Pumpkin Patch Ave
- 6080 Saint Petersburg Dr
- 2234 Falling Rain Dr
- 6028 Las Nubes Dr
- 2179 Raspberry Hill Rd
- 6311 American Beauty Ave
- 6223 E Sahara Ave Unit 137
- 6223 E Sahara Ave Unit 165
- 6223 E Sahara Ave Unit 167
- 6223 E Sahara Ave Unit 190
- 6223 E Sahara Ave Unit 81
- 6105 E Sahara Ave Unit 35
- 6105 E Sahara Ave Unit 117
- 6105 E Sahara Ave Unit 166
- 2279 Tulip Field St
- 2303 Tulip Field St
- 2267 Tulip Field St
- 2304 Orchard Valley Dr
- 2315 Tulip Field St
- 2288 Orchard Valley Dr
- 2320 Orchard Valley Dr
- 2255 Tulip Field St
- 2292 Tulip Field St
- 6232 Berry Patch Way
- 2272 Orchard Valley Dr
- 2300 Tulip Field St
- 2308 Tulip Field St
- 6238 Berry Patch Way
- 2316 Tulip Field St Unit n/a
- 6207 Elderberry Wine Ave
- 2256 Orchard Valley Dr
- 6199 Elderberry Wine Ave
- 6245 Berry Patch Way
- 6215 Elderberry Wine Ave