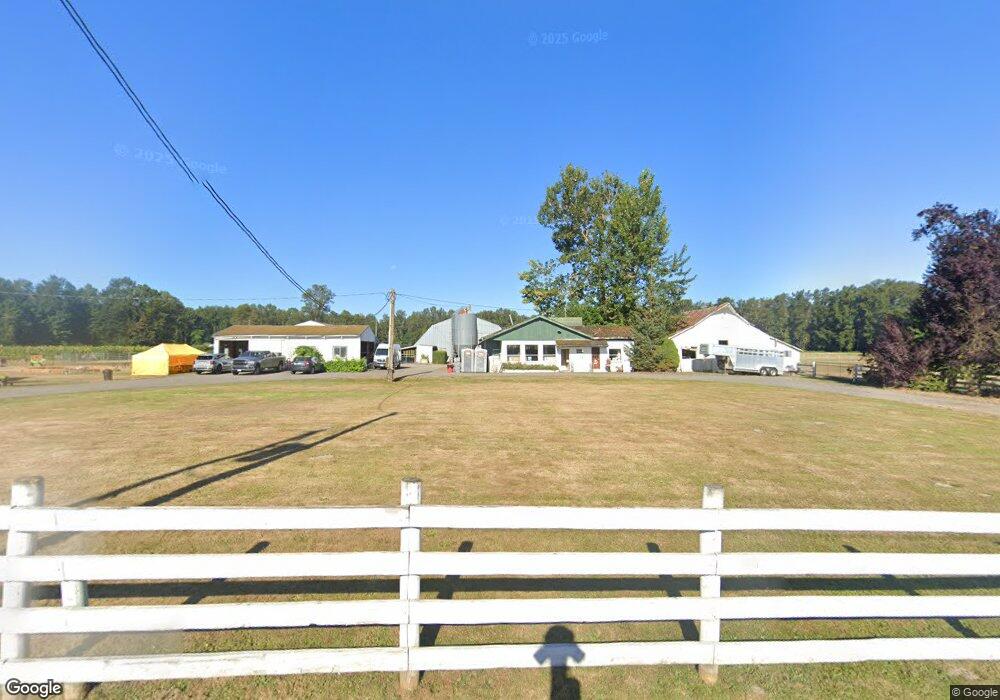
22912 67th Ave NE Arlington, WA 98223
Estimated Value: $1,511,000
3
Beds
2
Baths
2,200
Sq Ft
$687/Sq Ft
Est. Value
About This Home
This home is located at 22912 67th Ave NE, Arlington, WA 98223 and is currently estimated at $1,511,000, approximately $686 per square foot. 22912 67th Ave NE is a home located in Snohomish County with nearby schools including Presidents Elementary School, Haller Middle School, and Arlington High School.
Ownership History
Date
Name
Owned For
Owner Type
Purchase Details
Closed on
Apr 16, 2012
Sold by
Neunizg Linda
Bought by
City Of Arlington
Current Estimated Value
Purchase Details
Closed on
Mar 23, 2006
Sold by
Neunzig Bradley
Bought by
Neunzig Linda
Purchase Details
Closed on
Feb 15, 2005
Sold by
Neunzig Linda S
Bought by
Neunzig Bradley E
Home Financials for this Owner
Home Financials are based on the most recent Mortgage that was taken out on this home.
Original Mortgage
$359,650
Interest Rate
5.79%
Mortgage Type
Purchase Money Mortgage
Purchase Details
Closed on
Dec 5, 2002
Sold by
Klein Gerald Allan and Klein Loleta Rae
Bought by
Neunzig Bradley E and Neunzig Linda S
Home Financials for this Owner
Home Financials are based on the most recent Mortgage that was taken out on this home.
Original Mortgage
$225,000
Interest Rate
6.28%
Create a Home Valuation Report for This Property
The Home Valuation Report is an in-depth analysis detailing your home's value as well as a comparison with similar homes in the area
Home Values in the Area
Average Home Value in this Area
Purchase History
| Date | Buyer | Sale Price | Title Company |
|---|---|---|---|
| City Of Arlington | $80,280 | 1St Am | |
| Neunzig Linda | -- | None Available | |
| Neunzig Bradley E | $11,235 | First American Title Ins Co | |
| Neunzig Bradley E | $375,000 | First American Title Ins Co |
Source: Public Records
Mortgage History
| Date | Status | Borrower | Loan Amount |
|---|---|---|---|
| Previous Owner | Neunzig Bradley E | $359,650 | |
| Previous Owner | Neunzig Bradley E | $225,000 | |
| Closed | Neunzig Bradley E | $131,250 |
Source: Public Records
Tax History Compared to Growth
Tax History
| Year | Tax Paid | Tax Assessment Tax Assessment Total Assessment is a certain percentage of the fair market value that is determined by local assessors to be the total taxable value of land and additions on the property. | Land | Improvement |
|---|---|---|---|---|
| 2025 | $2,644 | $822,200 | $499,500 | $322,700 |
| 2024 | $2,644 | $780,400 | $509,000 | $271,400 |
| 2023 | $2,802 | $817,700 | $509,000 | $308,700 |
| 2022 | $3,037 | $701,300 | $439,000 | $262,300 |
| 2020 | $2,947 | $612,800 | $388,000 | $224,800 |
| 2019 | $2,875 | $604,100 | $388,000 | $216,100 |
| 2018 | $3,217 | $572,900 | $366,000 | $206,900 |
| 2017 | $3,056 | $549,700 | $352,000 | $197,700 |
| 2016 | $3,811 | $564,600 | $320,000 | $244,600 |
| 2015 | $3,541 | $243,100 | $28,400 | $214,700 |
| 2013 | $3,120 | $409,900 | $238,000 | $171,900 |
Source: Public Records
Map
Nearby Homes
- 105 E Cox Ave Unit 4
- 105 E Cox Ave Unit 10
- 2015 Washington 530
- 5222 233rd Place NE
- 530 N Washington Ave
- 113 N Lenore Ave
- 317 S Olympic Ave
- 318 S French Ave
- 8715 E Gilman Ave
- 8727 E Gilman Ave
- 7805 Jensen Farm Ln Unit G3
- 910 Medical Center Dr Unit B-203
- 12400 212th St NE
- 9007 Arlington Heights Rd
- 20505 81st Dr NE
- 0 77th Ave NE
- 20505 Tveit Rd
- 19920 67th Ave NE Unit 40
- 4718 252nd St NE
- 25106 47th Ave NE
- 22732 67th Ave NE
- 22715 67th Ave NE
- 7109 Schloman Rd
- 6630 Dike Rd
- 7220 Schloman Rd
- 7304 Schloman Rd
- 23324 Dike Rd
- 23324 Dike Rd
- 6220 Dike Rd
- 23230 State Route 9 NE
- 22630 Dike Rd
- 22405 59th Ave NE
- 23320 State Route 9 NE
- 155 Xx Highway 9
- 23406 State Route 9 NE
- 23202 Dike Rd
- 23530 Washington 9
- 120 W Burke Ave
- 127 W Gilman Ave Unit +129