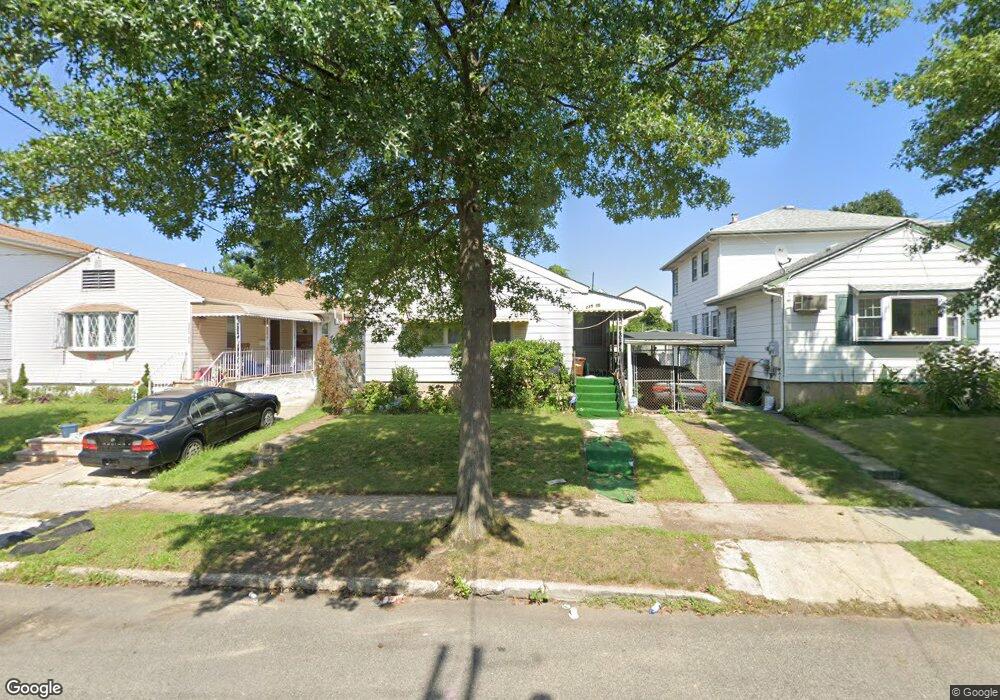
22915 Edgewood Ave Springfield Gardens, NY 11413
Brookville NeighborhoodEstimated Value: $929,995 - $1,221,000
--
Bed
--
Bath
2,379
Sq Ft
$452/Sq Ft
Est. Value
About This Home
This home is located at 22915 Edgewood Ave, Springfield Gardens, NY 11413 and is currently estimated at $1,075,749, approximately $452 per square foot. 22915 Edgewood Ave is a home located in Queens County with nearby schools including P.S. 181 Brookfield, Collaborative Arts Middle School, and Linden Seventh-Day Adventist School.
Ownership History
Date
Name
Owned For
Owner Type
Purchase Details
Closed on
Sep 29, 2021
Sold by
Thames Road Management Llc
Bought by
Patrick Junior and Patrick Wilinda
Current Estimated Value
Home Financials for this Owner
Home Financials are based on the most recent Mortgage that was taken out on this home.
Original Mortgage
$1,063,287
Outstanding Balance
$969,619
Interest Rate
2.8%
Mortgage Type
Purchase Money Mortgage
Estimated Equity
$106,130
Purchase Details
Closed on
Jan 31, 2020
Sold by
Thompson Austin R and Thompson Waveney A
Bought by
Thames Road Management Llc
Purchase Details
Closed on
Sep 11, 1998
Sold by
Swaby John and Swaby Parish
Bought by
Thompson Austin R and Thompson Waverey A
Home Financials for this Owner
Home Financials are based on the most recent Mortgage that was taken out on this home.
Original Mortgage
$173,800
Interest Rate
6.8%
Mortgage Type
FHA
Create a Home Valuation Report for This Property
The Home Valuation Report is an in-depth analysis detailing your home's value as well as a comparison with similar homes in the area
Home Values in the Area
Average Home Value in this Area
Purchase History
| Date | Buyer | Sale Price | Title Company |
|---|---|---|---|
| Patrick Junior | $1,100,000 | -- | |
| Thames Road Management Llc | $245,000 | -- | |
| Thompson Austin R | $180,000 | First American Title Ins Co |
Source: Public Records
Mortgage History
| Date | Status | Borrower | Loan Amount |
|---|---|---|---|
| Open | Patrick Junior | $1,063,287 | |
| Previous Owner | Thompson Austin R | $173,800 |
Source: Public Records
Tax History Compared to Growth
Tax History
| Year | Tax Paid | Tax Assessment Tax Assessment Total Assessment is a certain percentage of the fair market value that is determined by local assessors to be the total taxable value of land and additions on the property. | Land | Improvement |
|---|---|---|---|---|
| 2025 | $8,642 | $44,614 | $11,529 | $33,085 |
| 2024 | $8,642 | $43,027 | $11,753 | $31,274 |
| 2023 | $8,341 | $41,530 | $10,713 | $30,817 |
| 2022 | $4,985 | $35,700 | $9,660 | $26,040 |
| 2021 | $5,215 | $33,720 | $9,660 | $24,060 |
| 2020 | $4,948 | $33,720 | $9,660 | $24,060 |
| 2019 | $4,321 | $30,720 | $9,660 | $21,060 |
| 2018 | $3,944 | $20,808 | $6,714 | $14,094 |
| 2017 | $3,942 | $20,808 | $7,113 | $13,695 |
| 2016 | $3,818 | $20,808 | $7,113 | $13,695 |
| 2015 | $2,246 | $19,482 | $6,367 | $13,115 |
| 2014 | $2,246 | $18,380 | $7,201 | $11,179 |
Source: Public Records
Map
Nearby Homes
- 22820 Edgewood Ave
- 143-56 229th St
- 142-29 230th Place
- 14419 230 St
- 14426 229th St
- 229-11 141st Ave
- 144-23 231st St
- 139-55 230th Place Unit 55
- 14437 231st St
- 143-08 224th St
- 225-19 141st Ave
- 139-23 230th St
- 224-14 141st Ave
- 139-16 230th Place
- 142-16 223rd St
- 139-18 232nd St
- 145-22 232nd St
- 144-49 223rd St
- 233-1 Mentone Ave
- 14557 229th St
- 22909 Edgewood Ave
- 22919 Edgewood Ave
- 22909 Edgewood Ave
- 22905 Edgewood Ave
- 22923 Edgewood Ave
- 22835 Edgewood Ave
- 22927 Edgewood Ave
- 23016 Lansing Ave
- 23020 Lansing Ave
- 23012 Lansing Ave
- 23024 Lansing Ave
- 240-23 Edgewood Ave
- 240-21 Edgewood Ave
- 240-17 Edgewood Ave
- 229-31 Edgewood Ave
- 22920 S Conduit Ave
- 230-20 Lansing Ave Unit 2nd. Floor
- 230-20 Lansing Ave
- 23020 Lansing Ave