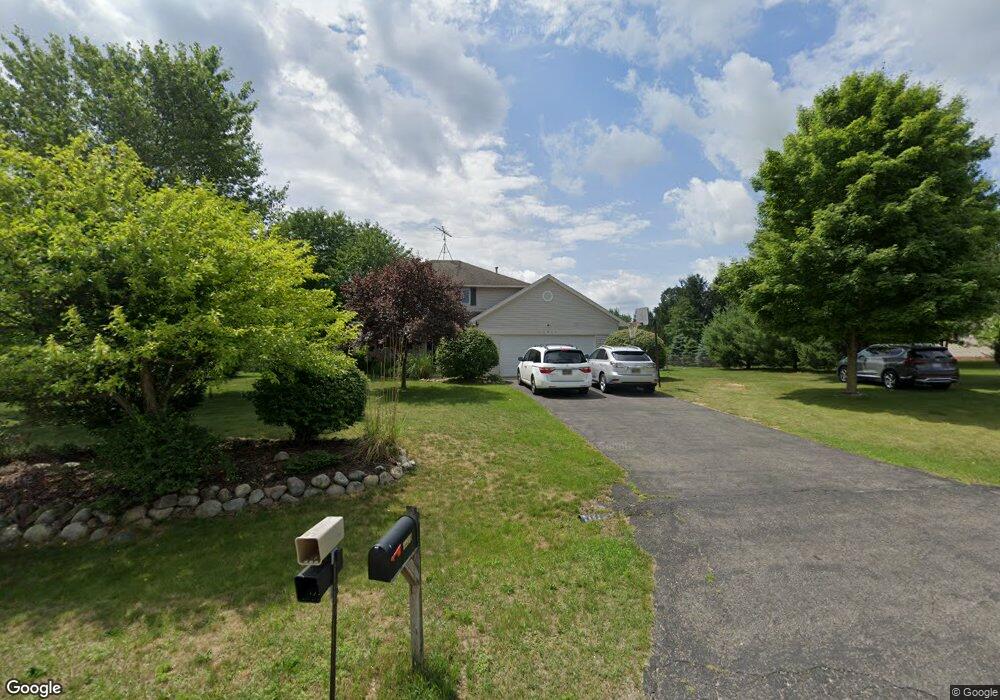
22917 Canary Ave Mattawan, MI 49071
Estimated Value: $351,516 - $381,000
3
Beds
3
Baths
2,334
Sq Ft
$158/Sq Ft
Est. Value
About This Home
This home is located at 22917 Canary Ave, Mattawan, MI 49071 and is currently estimated at $368,129, approximately $157 per square foot. 22917 Canary Ave is a home located in Van Buren County with nearby schools including Mattawan Early Elementary School, Mattawan Later Elementary School, and Mattawan Early Childhood Education Center.
Ownership History
Date
Name
Owned For
Owner Type
Purchase Details
Closed on
Jun 2, 2023
Sold by
Olson Roger L
Bought by
Hinson Marshall
Current Estimated Value
Purchase Details
Closed on
Dec 27, 2006
Sold by
Federal Home Loan Mortgage Corporation
Bought by
Olson Bradley J and Olson Heather M
Home Financials for this Owner
Home Financials are based on the most recent Mortgage that was taken out on this home.
Original Mortgage
$110,250
Interest Rate
6.24%
Mortgage Type
Balloon
Purchase Details
Closed on
Apr 13, 2006
Sold by
Latora Daniel R and Latora Maureen
Bought by
Federal Home Loan Mortgage Corporation
Purchase Details
Closed on
Jul 27, 2001
Sold by
Aaberg Daniel and Aaberg Gaye
Bought by
Latora Daniel R and Latora Maureen
Purchase Details
Closed on
Apr 5, 1996
Bought by
Aaberg Daniel and Aaberg Gaye
Create a Home Valuation Report for This Property
The Home Valuation Report is an in-depth analysis detailing your home's value as well as a comparison with similar homes in the area
Home Values in the Area
Average Home Value in this Area
Purchase History
| Date | Buyer | Sale Price | Title Company |
|---|---|---|---|
| Hinson Marshall | $49,000 | None Listed On Document | |
| Olson Bradley J | $147,000 | None Available | |
| Federal Home Loan Mortgage Corporation | $139,111 | None Available | |
| Latora Daniel R | $175,000 | -- | |
| Aaberg Daniel | $137,000 | -- |
Source: Public Records
Mortgage History
| Date | Status | Borrower | Loan Amount |
|---|---|---|---|
| Previous Owner | Olson Bradley J | $110,250 |
Source: Public Records
Tax History Compared to Growth
Tax History
| Year | Tax Paid | Tax Assessment Tax Assessment Total Assessment is a certain percentage of the fair market value that is determined by local assessors to be the total taxable value of land and additions on the property. | Land | Improvement |
|---|---|---|---|---|
| 2025 | $917 | $159,900 | $0 | $0 |
| 2024 | $917 | $152,600 | $0 | $0 |
| 2023 | $874 | $142,600 | $0 | $0 |
| 2022 | $2,811 | $125,200 | $0 | $0 |
| 2021 | $2,752 | $104,900 | $15,800 | $89,100 |
| 2020 | $2,603 | $104,900 | $15,800 | $89,100 |
| 2019 | $2,485 | $95,900 | $95,900 | $0 |
| 2018 | $2,428 | $93,000 | $93,000 | $0 |
| 2017 | $2,345 | $86,800 | $0 | $0 |
| 2016 | $2,371 | $84,900 | $0 | $0 |
| 2015 | $2,064 | $84,900 | $0 | $0 |
| 2014 | $2,027 | $82,000 | $0 | $0 |
| 2013 | -- | $73,900 | $73,900 | $0 |
Source: Public Records
Map
Nearby Homes
- 24108 Cr 375
- 10696 W L Ave
- 23424 38th Ave
- 1710 Toscana St
- 2109 Toscana St
- 10387 W L Ave
- 2034 Sienna St
- 24402 Thousand Oaks Dr
- 1881 Sienna St
- 41240 County Road 652
- 10145 W Kl Ave
- 23440 E McGillen Ave Unit Parcel B
- 23440 E McGillen Ave Unit Parcel A
- 0 N 1st St
- 10791 W Main St
- 58927 Norton St
- 58418 Norton St
- 22108 W M 43
- 24532 Vargas
- Integrity 1830 Plan at Silver Oaks
- 22865 Canary Ave
- 22979 Canary Ave
- 22916 Blackbird Ave
- 22978 Blackbird Ave
- 22864 Blackbird Ave
- 22918 Canary Ave
- 22866 Canary Ave
- 22813 Canary Ave
- 23031 Canary Ave
- 22980 Canary Ave
- 23030 Blackbird Ave
- 22812 Blackbird Ave
- 22814 Canary Ave
- 23032 Canary Ave
- 23093 Canary Ave
- 22915 Blackbird Ave
- 22913 Bobolink Ave
- 22861 Bobolink Ave
- 23039 Blackbird Ave
- 41087 Chickadee St