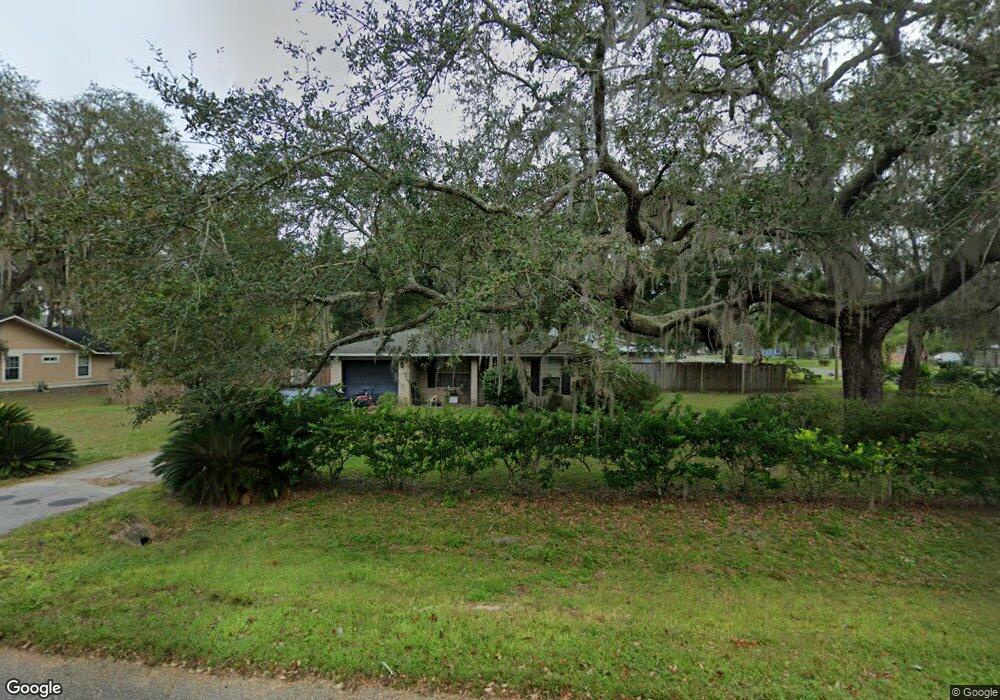
22918 SE 60th Ln Hawthorne, FL 32640
Estimated Value: $169,847 - $185,000
2
Beds
1
Bath
912
Sq Ft
$194/Sq Ft
Est. Value
About This Home
This home is located at 22918 SE 60th Ln, Hawthorne, FL 32640 and is currently estimated at $176,962, approximately $194 per square foot. 22918 SE 60th Ln is a home located in Alachua County with nearby schools including Chester Shell Elementary School and Hawthorne Middle/High School.
Ownership History
Date
Name
Owned For
Owner Type
Purchase Details
Closed on
Jun 19, 2020
Sold by
Carrington Mortgage Services Llc
Bought by
Brooker Richard Burton and Brooker Kelly Jenette
Current Estimated Value
Purchase Details
Closed on
Aug 29, 2008
Sold by
Chapunoff David
Bought by
Godbolt Kutura T
Home Financials for this Owner
Home Financials are based on the most recent Mortgage that was taken out on this home.
Original Mortgage
$94,749
Interest Rate
6.21%
Mortgage Type
FHA
Purchase Details
Closed on
Jun 25, 1999
Sold by
Brown Tracy C and Emmons Tracy C
Bought by
Chapunoff David
Home Financials for this Owner
Home Financials are based on the most recent Mortgage that was taken out on this home.
Original Mortgage
$46,000
Interest Rate
7.27%
Mortgage Type
Purchase Money Mortgage
Purchase Details
Closed on
Jul 31, 1991
Bought by
Godbolt Kutura T
Create a Home Valuation Report for This Property
The Home Valuation Report is an in-depth analysis detailing your home's value as well as a comparison with similar homes in the area
Home Values in the Area
Average Home Value in this Area
Purchase History
| Date | Buyer | Sale Price | Title Company |
|---|---|---|---|
| Brooker Richard Burton | $81,000 | Attorney | |
| Brooker Richard Burton | $81,000 | None Available | |
| Godbolt Kutura T | $96,000 | Community Title Llc | |
| Chapunoff David | $51,000 | -- | |
| Godbolt Kutura T | $43,500 | -- |
Source: Public Records
Mortgage History
| Date | Status | Borrower | Loan Amount |
|---|---|---|---|
| Previous Owner | Godbolt Kutura T | $94,749 | |
| Previous Owner | Chapunoff David | $46,000 |
Source: Public Records
Tax History Compared to Growth
Tax History
| Year | Tax Paid | Tax Assessment Tax Assessment Total Assessment is a certain percentage of the fair market value that is determined by local assessors to be the total taxable value of land and additions on the property. | Land | Improvement |
|---|---|---|---|---|
| 2024 | $1,124 | $80,399 | -- | -- |
| 2023 | $1,124 | $78,058 | $0 | $0 |
| 2022 | $1,054 | $75,785 | $0 | $0 |
| 2021 | $1,008 | $73,578 | $12,000 | $61,578 |
| 2020 | $941 | $65,422 | $0 | $0 |
| 2019 | $935 | $63,951 | $9,500 | $54,451 |
| 2018 | $945 | $65,040 | $0 | $0 |
| 2017 | $955 | $63,710 | $0 | $0 |
| 2016 | $817 | $62,400 | $0 | $0 |
| 2015 | $832 | $63,100 | $0 | $0 |
| 2014 | $833 | $62,800 | $0 | $0 |
| 2013 | -- | $67,200 | $9,500 | $57,700 |
Source: Public Records
Map
Nearby Homes
- 107 & 109 Dixie St
- 22644 SE Hawthorne Rd
- 0 SE 58th Place
- 0 SE Hawthorne Rd
- 000 State Rd
- 336 Portland St
- 338 Portland St
- 5627 SE 223rd St
- 22185 SE 57th Ave
- 13575 SE Us Highway 301
- 10503 SE Us Highway 301
- 6004 U S 301
- 000 SE 246th Terrace
- 00 SE US Hwy 301
- 7015 SE 221st St
- 21927 SE 69th Ave
- 238 Alabama Ave
- 21524 SE 65th Ave
- 0 SE 69th Ave
- 22816 SE 64th Ave
- 5932 SE 229th Terrace
- 0000 SE 60th Ln
- 22904 SE 60th Ln
- 22921 SE 60th Ln
- 5943 SE 229th Terrace
- 22945 SE 60th Ln
- 6003 SE 228th Terrace
- 5918 SE 229th Terrace
- 5929 SE 229th Terrace
- 22876 SE 60th Ln
- 23017 SE 60th Ln
- 5913 SE 229th Terrace
- 6027 SE 228th Terrace
- 5904 SE 229th Terrace
- 5930 SE 230th Terrace
- 6008 SE 228th Terrace
- 5903 SE 229th Terrace
- 5914 SE 230th Terrace
- 6135 SE 228th Terrace