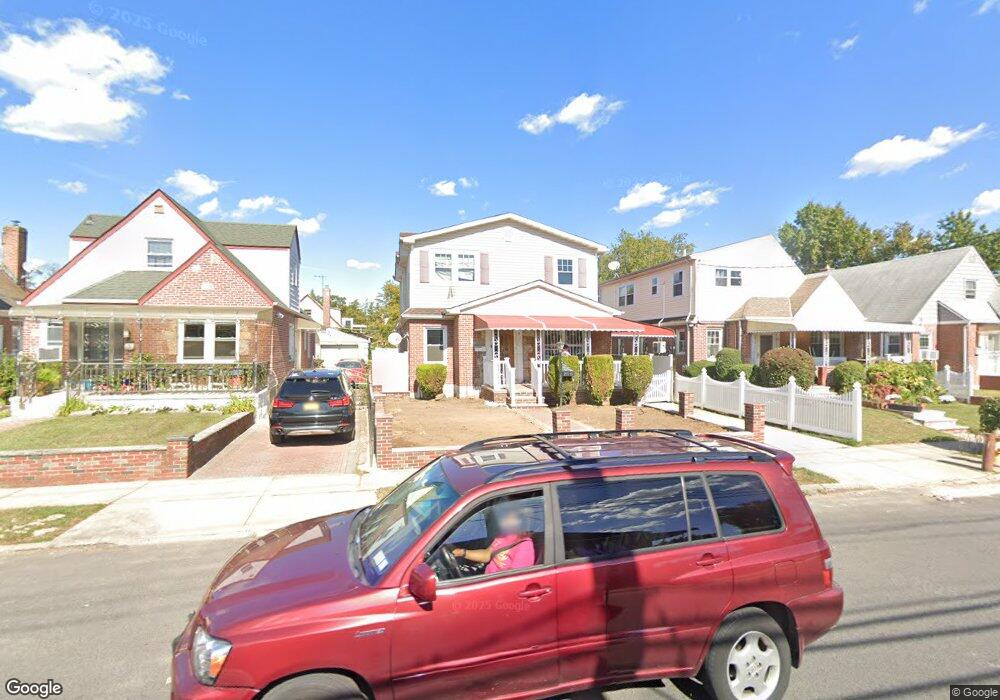
22919 130th Ave Springfield Gardens, NY 11413
Laurelton NeighborhoodEstimated Value: $859,202 - $975,000
5
Beds
3
Baths
1,684
Sq Ft
$535/Sq Ft
Est. Value
About This Home
This home is located at 22919 130th Ave, Springfield Gardens, NY 11413 and is currently estimated at $901,051, approximately $535 per square foot. 22919 130th Ave is a home located in Queens County with nearby schools including P.S. 132 - Ralph Bunche, Collaborative Arts Middle School, and Cambria Center For The Gifted Child.
Ownership History
Date
Name
Owned For
Owner Type
Purchase Details
Closed on
Aug 7, 2024
Sold by
Browne Lorraine M and Browne Valerie A
Bought by
Rahman Md S and Sharmin Rebaka
Current Estimated Value
Home Financials for this Owner
Home Financials are based on the most recent Mortgage that was taken out on this home.
Original Mortgage
$609,000
Outstanding Balance
$600,987
Interest Rate
6.86%
Mortgage Type
Purchase Money Mortgage
Estimated Equity
$300,064
Purchase Details
Closed on
Jan 2, 2008
Sold by
Browne Valerie A
Bought by
Browne Lorraine M and Browne Valerie A
Purchase Details
Closed on
Jul 12, 2002
Sold by
King Gloria
Bought by
Browne Valerie A
Home Financials for this Owner
Home Financials are based on the most recent Mortgage that was taken out on this home.
Original Mortgage
$214,400
Interest Rate
6.61%
Create a Home Valuation Report for This Property
The Home Valuation Report is an in-depth analysis detailing your home's value as well as a comparison with similar homes in the area
Home Values in the Area
Average Home Value in this Area
Purchase History
| Date | Buyer | Sale Price | Title Company |
|---|---|---|---|
| Rahman Md S | $870,000 | -- | |
| Rahman Md S | $870,000 | -- | |
| Browne Lorraine M | -- | -- | |
| Browne Lorraine M | -- | -- | |
| Browne Valerie A | -- | -- | |
| Browne Valerie A | -- | -- |
Source: Public Records
Mortgage History
| Date | Status | Borrower | Loan Amount |
|---|---|---|---|
| Open | Rahman Md S | $609,000 | |
| Closed | Rahman Md S | $609,000 | |
| Previous Owner | Browne Valerie A | $214,400 | |
| Closed | Browne Lorraine M | $0 |
Source: Public Records
Tax History Compared to Growth
Tax History
| Year | Tax Paid | Tax Assessment Tax Assessment Total Assessment is a certain percentage of the fair market value that is determined by local assessors to be the total taxable value of land and additions on the property. | Land | Improvement |
|---|---|---|---|---|
| 2025 | $6,436 | $33,696 | $5,949 | $27,747 |
| 2024 | $6,448 | $33,443 | $5,954 | $27,489 |
| 2023 | $6,056 | $31,550 | $5,753 | $25,797 |
| 2022 | $5,655 | $35,100 | $7,680 | $27,420 |
| 2021 | $5,613 | $33,360 | $7,680 | $25,680 |
| 2020 | $5,648 | $31,860 | $7,680 | $24,180 |
| 2019 | $5,537 | $32,280 | $7,680 | $24,600 |
| 2018 | $5,062 | $26,292 | $5,350 | $20,942 |
| 2017 | $4,757 | $24,804 | $6,917 | $17,887 |
| 2016 | $4,368 | $24,804 | $6,917 | $17,887 |
| 2015 | $3,106 | $25,440 | $6,420 | $19,020 |
| 2014 | $3,106 | $25,440 | $6,420 | $19,020 |
Source: Public Records
Map
Nearby Homes
- 12908 Francis Lewis Blvd
- 129-08 Francis Lewis Blvd
- 13001 228th St
- 130-20 232nd St
- 231-15 128th Rd
- 130-16 233rd St
- 130-07 225th St
- 12831 233rd St
- 131-25 227th St
- 23107 126th Ave
- 131-33 228th St
- 13144 Francis Lewis Blvd
- 12819 234th St
- 131-18 226th St
- 13062 225th St
- 233-6 131st Ave Unit 1
- 234-16 130th Ave
- 131-41 226th St Unit 60
- 131-09 234th St Unit Lower Level
- 120-47 228th St
- 229-19 130th Ave
- 22919 130th Ave
- 229-11 130th Ave
- 22915 130th Ave
- 22923 130th Ave
- 22911 130th Ave
- 22911 130th Ave
- 23003 130th Ave
- 229-23 130th Ave
- 22920 129th Ave
- 229-24 129th Ave
- 13002 230th St
- 22916 129th Ave
- 22907 130th Ave
- 22924 129th Ave
- 23007 130th Ave
- 22912 129th Ave
- 22928 129th Ave
- 22912 129th Ave
- 229-36 129th Ave