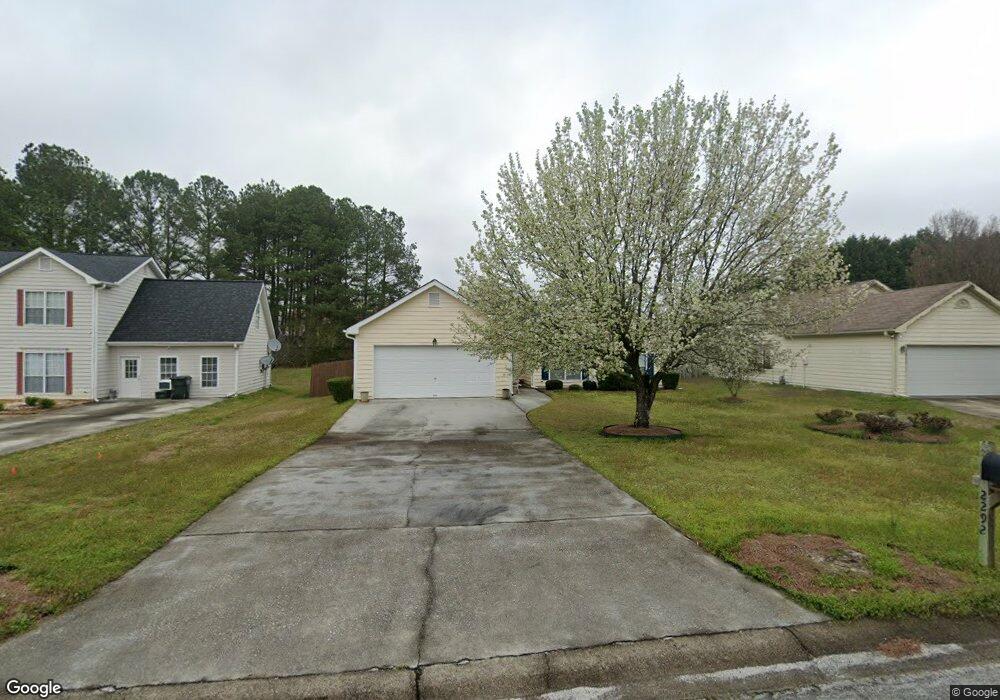
2292 Red Rose Ln Unit 1 Loganville, GA 30052
Estimated Value: $301,000 - $319,000
3
Beds
2
Baths
1,493
Sq Ft
$207/Sq Ft
Est. Value
About This Home
This home is located at 2292 Red Rose Ln Unit 1, Loganville, GA 30052 and is currently estimated at $309,790, approximately $207 per square foot. 2292 Red Rose Ln Unit 1 is a home located in Gwinnett County with nearby schools including Magill Elementary School, Grace Snell Middle School, and South Gwinnett High School.
Ownership History
Date
Name
Owned For
Owner Type
Purchase Details
Closed on
Nov 17, 2021
Sold by
Robertson Nova Clestelle
Bought by
The Nova Clestelle Robertson Trust
Current Estimated Value
Purchase Details
Closed on
Oct 28, 1999
Sold by
Mcgartland Michael L and Mcgartland Deborah L
Bought by
Robertson Nora C
Home Financials for this Owner
Home Financials are based on the most recent Mortgage that was taken out on this home.
Original Mortgage
$45,000
Interest Rate
7.76%
Mortgage Type
New Conventional
Purchase Details
Closed on
Dec 15, 1994
Sold by
Segars Terry A Inc
Bought by
Mcgartland Michael L Deborah
Home Financials for this Owner
Home Financials are based on the most recent Mortgage that was taken out on this home.
Original Mortgage
$85,400
Interest Rate
7.25%
Create a Home Valuation Report for This Property
The Home Valuation Report is an in-depth analysis detailing your home's value as well as a comparison with similar homes in the area
Home Values in the Area
Average Home Value in this Area
Purchase History
| Date | Buyer | Sale Price | Title Company |
|---|---|---|---|
| The Nova Clestelle Robertson Trust | -- | -- | |
| The Nova Clestelle Robertson Trust | -- | -- | |
| Robertson Nora C | $106,000 | -- | |
| Mcgartland Michael L Deborah | $89,900 | -- |
Source: Public Records
Mortgage History
| Date | Status | Borrower | Loan Amount |
|---|---|---|---|
| Previous Owner | Robertson Nora C | $45,000 | |
| Previous Owner | Mcgartland Michael L Deborah | $85,400 |
Source: Public Records
Tax History Compared to Growth
Tax History
| Year | Tax Paid | Tax Assessment Tax Assessment Total Assessment is a certain percentage of the fair market value that is determined by local assessors to be the total taxable value of land and additions on the property. | Land | Improvement |
|---|---|---|---|---|
| 2024 | $760 | $116,920 | $18,000 | $98,920 |
| 2023 | $760 | $118,920 | $27,080 | $91,840 |
| 2022 | $721 | $105,160 | $19,200 | $85,960 |
| 2021 | $709 | $70,480 | $14,000 | $56,480 |
| 2020 | $707 | $63,800 | $12,000 | $51,800 |
| 2019 | $663 | $59,240 | $10,000 | $49,240 |
| 2018 | $644 | $59,240 | $10,000 | $49,240 |
| 2016 | $666 | $36,720 | $6,000 | $30,720 |
| 2015 | $675 | $36,720 | $6,000 | $30,720 |
| 2014 | $679 | $36,720 | $6,000 | $30,720 |
Source: Public Records
Map
Nearby Homes
- 1649 Hay Patch Ln
- 3590 Stephens Creek Place Unit 1
- 1539 Hay Patch Ln
- 1670 Rose Garden Ln
- 1680 Rose Garden Ln
- 1601 Savory Way
- 1621 Savory Way
- 3564 Arrow Root Cir
- 1783 Juniper Berry Way
- 3614 Arrow Root Cir
- 1795 Red Rose Ln
- 1350 Summer Lake Terrace
- 1471 Stephens View Dr
- 3624 Squires Park Ln
- 3614 Squires Park Ln
- 1692 Juniper Berry Way
- 2302 Red Rose Ln
- 2282 Red Rose Ln Unit 1
- 2312 Red Rose Ln
- 3645 Range Way
- 2272 Red Rose Ln
- 3655 Range Way
- 3635 Range Way Unit 1
- 3665 Range Way
- 2322 Red Rose Ln Unit 1
- 3625 Range Way
- 2295 Red Rose Ln Unit 1
- 2305 Red Rose Ln Unit 2305
- 2305 Red Rose Ln
- 2262 Red Rose Ln
- 3675 Range Way
- 3615 Range Way Unit 1
- 2252 Red Rose Ln
- 2315 Red Rose Ln
- 2332 Red Rose Ln Unit 1
- 3685 Range Way Unit 1