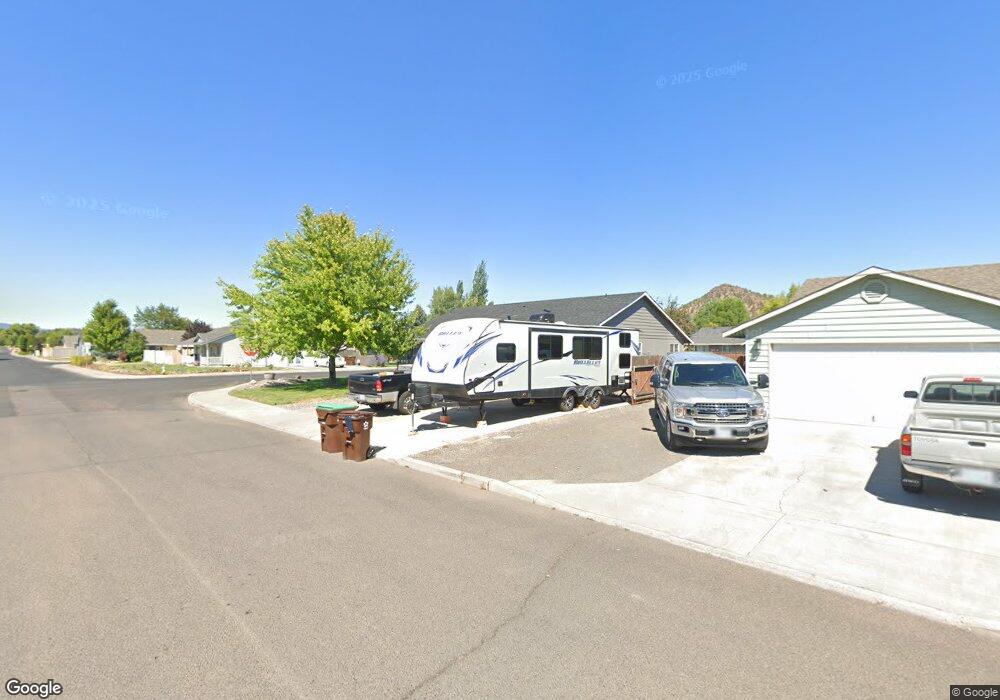
2294 NE Cherry Loop Prineville, OR 97754
Estimated Value: $386,861 - $394,000
3
Beds
2
Baths
1,274
Sq Ft
$306/Sq Ft
Est. Value
About This Home
This home is located at 2294 NE Cherry Loop, Prineville, OR 97754 and is currently estimated at $390,431, approximately $306 per square foot. 2294 NE Cherry Loop is a home located in Crook County with nearby schools including Crook County Middle School, Crook County High School, and Cascade Virtual Academy.
Ownership History
Date
Name
Owned For
Owner Type
Purchase Details
Closed on
Apr 11, 2022
Sold by
Andrew Nelson Shawn
Bought by
Nelson Michelle Lynn
Current Estimated Value
Purchase Details
Closed on
Jun 26, 2020
Sold by
Nelson Michelle Lynn and Powers Michelle L
Bought by
Nelson Michelle Lynn and Nelson Shawn Andrew
Home Financials for this Owner
Home Financials are based on the most recent Mortgage that was taken out on this home.
Original Mortgage
$167,000
Interest Rate
3.2%
Mortgage Type
New Conventional
Purchase Details
Closed on
Sep 27, 2011
Sold by
Penkowski Carla and Gulstrom Alfred Henry
Bought by
Powers Michelle L
Home Financials for this Owner
Home Financials are based on the most recent Mortgage that was taken out on this home.
Original Mortgage
$111,398
Interest Rate
4.09%
Mortgage Type
New Conventional
Purchase Details
Closed on
Feb 8, 2010
Sold by
Gulstrom Alfred and Gulstrom Carol J
Bought by
Gulstrom Alfred and Gulstrom Carol J
Create a Home Valuation Report for This Property
The Home Valuation Report is an in-depth analysis detailing your home's value as well as a comparison with similar homes in the area
Home Values in the Area
Average Home Value in this Area
Purchase History
| Date | Buyer | Sale Price | Title Company |
|---|---|---|---|
| Nelson Michelle Lynn | -- | None Listed On Document | |
| Nelson Michelle Lynn | -- | Amerititle | |
| Powers Michelle L | $107,500 | Amerititle | |
| Gulstrom Alfred | -- | None Available |
Source: Public Records
Mortgage History
| Date | Status | Borrower | Loan Amount |
|---|---|---|---|
| Previous Owner | Nelson Michelle Lynn | $167,000 | |
| Previous Owner | Powers Michelle L | $111,398 |
Source: Public Records
Tax History Compared to Growth
Tax History
| Year | Tax Paid | Tax Assessment Tax Assessment Total Assessment is a certain percentage of the fair market value that is determined by local assessors to be the total taxable value of land and additions on the property. | Land | Improvement |
|---|---|---|---|---|
| 2024 | $2,460 | $152,540 | -- | -- |
| 2023 | $2,375 | $148,100 | $0 | $0 |
| 2022 | $2,302 | $143,790 | $0 | $0 |
| 2021 | $2,289 | $139,610 | $0 | $0 |
| 2020 | $2,227 | $135,544 | $0 | $0 |
| 2019 | $2,151 | $127,763 | $0 | $0 |
| 2018 | $2,093 | $127,763 | $0 | $0 |
| 2017 | $2,058 | $124,042 | $0 | $0 |
| 2016 | $1,968 | $116,921 | $0 | $0 |
| 2015 | $1,886 | $116,921 | $0 | $0 |
| 2013 | -- | $110,210 | $0 | $0 |
Source: Public Records
Map
Nearby Homes
- 2226 NE Cherry Loop
- 948 NE Yew St
- 1077 NE Mahogany St
- 0 NE Bobbi Ct
- 630 NE Fieldstone Ln
- 1112 NE Cobblestone Ct
- 1196 NE Cobblestone Ct
- 1242 NE Cobblestone Ct
- 1162 NE Cobblestone Ct
- 1163 NE Henry Dr
- 312 NE Bronco Way
- 1670 NE Sunstone Ave
- 1144 NE Henry Dr
- 1676 NE Sunstone Ave
- 1187 NE Henry Dr
- 1192 NE Henry Dr
- 2586 NE Colleen Rd
- 2648 NE Colleen Rd
- 1337 NE Barney St
- 591 NE Brookstone Dr
- 2290 NE Cherry Loop
- 2220 NE Cherry Loop
- 2295 NE Cherry Loop
- 2222 NE Cherry Loop
- 2288 NE Cherry Loop
- 2346 NE Sugarpine Rd
- 2311 NE Yellowpine Rd
- 2341 NE Sugarpine Rd
- 2341 NE Sugar Pine Rd
- 2315 NE Yellowpine Rd
- 2291 NE Cherry Loop
- 2367 NE Sugarpine Rd
- 2287 NE Cherry Loop
- 910 NE Snowberry St
- 922 NE Snowberry St
- 2232 NE Cherry Loop
- 2319 NE Yellowpine Rd
- 936 NE Snowberry St
- 3175 Yellow Pine Rd
- 2861 Yellow Pine Rd