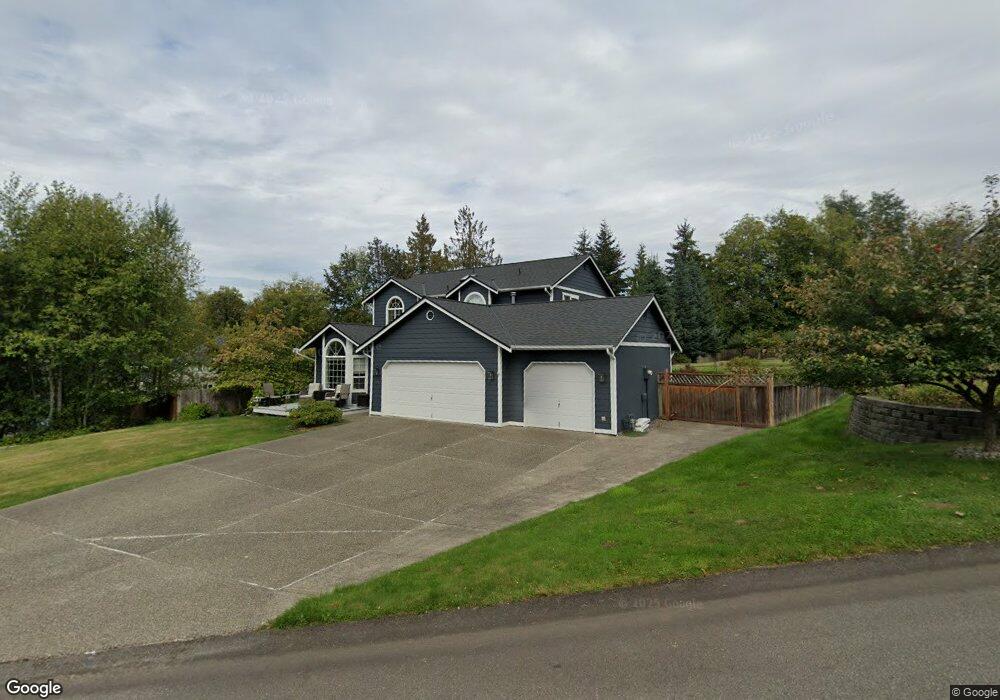
2294 Steamboat Loop E Port Orchard, WA 98366
Parkwood NeighborhoodEstimated Value: $545,000 - $599,000
4
Beds
3
Baths
1,850
Sq Ft
$311/Sq Ft
Est. Value
About This Home
This home is located at 2294 Steamboat Loop E, Port Orchard, WA 98366 and is currently estimated at $575,409, approximately $311 per square foot. 2294 Steamboat Loop E is a home located in Kitsap County with nearby schools including Orchard Heights Elementary School, Marcus Whitman Middle School, and South Kitsap High School.
Ownership History
Date
Name
Owned For
Owner Type
Purchase Details
Closed on
Jul 14, 2003
Sold by
Lang James G and Lang Kristen L
Bought by
Bray Michael J and Bray Robin L
Current Estimated Value
Home Financials for this Owner
Home Financials are based on the most recent Mortgage that was taken out on this home.
Original Mortgage
$155,000
Outstanding Balance
$65,501
Interest Rate
5.18%
Mortgage Type
Purchase Money Mortgage
Estimated Equity
$509,908
Purchase Details
Closed on
Jun 25, 1999
Sold by
Remmer James H and Remmer Roseann R
Bought by
Lang James G and Lang Kristen L
Home Financials for this Owner
Home Financials are based on the most recent Mortgage that was taken out on this home.
Original Mortgage
$128,500
Interest Rate
7.05%
Purchase Details
Closed on
Sep 7, 1994
Sold by
Grinnell Construction Inc
Bought by
Remmer James H and Remmer Roseann R
Home Financials for this Owner
Home Financials are based on the most recent Mortgage that was taken out on this home.
Original Mortgage
$146,189
Interest Rate
8.57%
Mortgage Type
Assumption
Create a Home Valuation Report for This Property
The Home Valuation Report is an in-depth analysis detailing your home's value as well as a comparison with similar homes in the area
Home Values in the Area
Average Home Value in this Area
Purchase History
| Date | Buyer | Sale Price | Title Company |
|---|---|---|---|
| Bray Michael J | $195,000 | Transnation Title Ins Co | |
| Lang James G | $164,000 | Transnation Title Insurance | |
| Remmer James H | $151,610 | Stewart Title Co |
Source: Public Records
Mortgage History
| Date | Status | Borrower | Loan Amount |
|---|---|---|---|
| Open | Bray Michael J | $155,000 | |
| Previous Owner | Lang James G | $128,500 | |
| Previous Owner | Remmer James H | $146,189 |
Source: Public Records
Tax History Compared to Growth
Tax History
| Year | Tax Paid | Tax Assessment Tax Assessment Total Assessment is a certain percentage of the fair market value that is determined by local assessors to be the total taxable value of land and additions on the property. | Land | Improvement |
|---|---|---|---|---|
| 2026 | $4,261 | $491,650 | $107,870 | $383,780 |
| 2025 | $4,261 | $485,780 | $89,820 | $395,960 |
| 2024 | $4,132 | $485,780 | $89,820 | $395,960 |
| 2023 | $4,105 | $485,780 | $89,820 | $395,960 |
| 2022 | $4,052 | $401,880 | $83,880 | $318,000 |
| 2021 | $3,790 | $355,370 | $77,950 | $277,420 |
| 2020 | $3,717 | $338,620 | $74,230 | $264,390 |
| 2019 | $3,060 | $305,220 | $73,130 | $232,090 |
| 2018 | $3,219 | $249,750 | $73,130 | $176,620 |
| 2017 | $2,760 | $249,750 | $73,130 | $176,620 |
| 2016 | $2,716 | $224,940 | $73,130 | $151,810 |
| 2015 | $2,629 | $220,560 | $73,130 | $147,430 |
| 2014 | -- | $217,640 | $73,130 | $144,510 |
| 2013 | -- | $228,820 | $81,000 | $147,820 |
Source: Public Records
Map
Nearby Homes
- 1341 Salt Point Place E
- 3817 SE Horstman Rd
- 4233 SE Horsehead Way
- 3140 E Washington St
- 0 E Washington St Unit NWM2337936
- 22 Lots E Washington St
- 0 Beach Dr E Unit NWM2448019
- 0 Beach Dr E Unit NWM2139946
- 0 Wendell Ave SE
- 4010 SE Lovell St
- 4798 E Stable Ln
- 4305 SE Elijah Ct
- 1200 Baby Doll Rd E
- 3900 SE Mile Hill Dr
- 3930 SE Mile Hill Dr
- 123 E 4th St
- 1663 Harrison Ave SE
- 1703 Harrison Ave SE
- 2949 SE Mile Hill Dr Unit C-2
- 3589 SE Pine Tree Dr
- 2288 Steamboat Loop E
- 2312 Steamboat Loop E
- 2306 Steamboat Loop E
- 2325 Steamboat Loop E
- 2283 Steamboat Loop E
- 2247 Steamboat Loop E
- 2318 Steamboat Loop E
- 2283 Steamboat E Lot#18 Loop
- 2300 Steamboat Loop E
- 2300 Steamboat Loop E
- 2282 Steamboat Loop E
- 2259 Steamboat Loop E
- 2259 Steamboat Loop E
- 2336 Steamboat Loop E
- 2324 Steamboat Loop E
- 2241 Steamboat Loop E
- 2342 Steamboat Loop E
- 2235 Steamboat Loop E
- 2265 Steamboat Loop E
- 2253 Steamboat Loop E