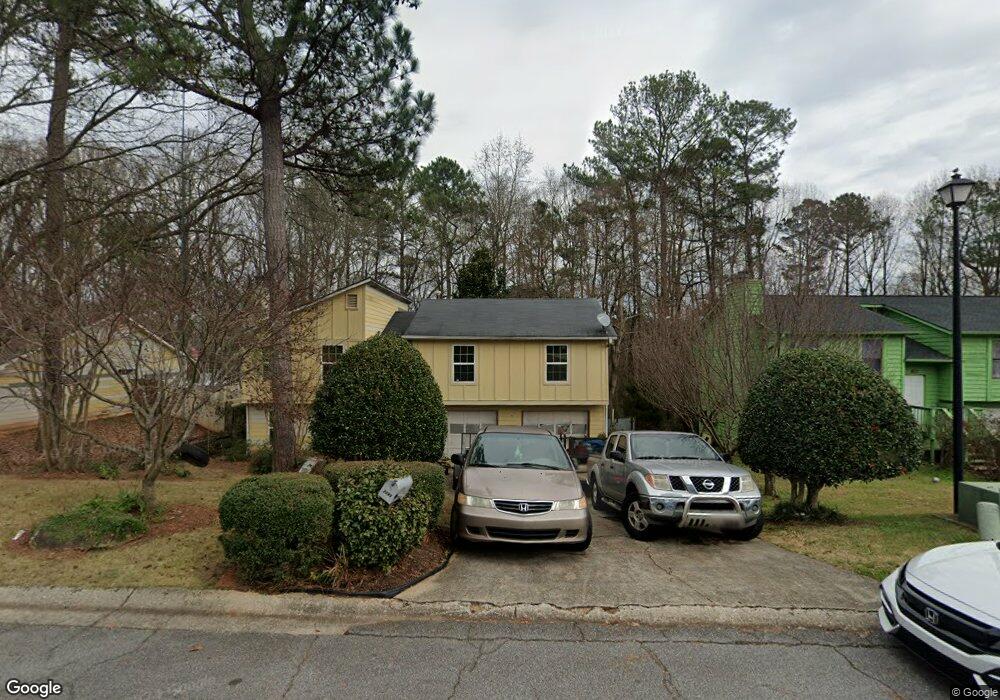
2295 Marshes Glenn Dr Unit 2 Norcross, GA 30071
Estimated Value: $322,764 - $380,000
3
Beds
2
Baths
1,332
Sq Ft
$262/Sq Ft
Est. Value
About This Home
This home is located at 2295 Marshes Glenn Dr Unit 2, Norcross, GA 30071 and is currently estimated at $348,941, approximately $261 per square foot. 2295 Marshes Glenn Dr Unit 2 is a home located in Gwinnett County with nearby schools including Baldwin Elementary, Summerour Middle School, and Paul Duke STEM High School.
Ownership History
Date
Name
Owned For
Owner Type
Purchase Details
Closed on
Nov 22, 2002
Sold by
Fant Marcus S and Fant Mary H
Bought by
Larumbe Jorge L
Current Estimated Value
Home Financials for this Owner
Home Financials are based on the most recent Mortgage that was taken out on this home.
Original Mortgage
$142,400
Outstanding Balance
$59,656
Interest Rate
6.15%
Mortgage Type
New Conventional
Estimated Equity
$289,285
Purchase Details
Closed on
Dec 10, 1998
Sold by
Landman Stuart
Bought by
Fant Marcus S and Fant Mary H
Home Financials for this Owner
Home Financials are based on the most recent Mortgage that was taken out on this home.
Original Mortgage
$112,935
Interest Rate
6.72%
Mortgage Type
FHA
Purchase Details
Closed on
Aug 5, 1997
Sold by
Union Planters Natl Bnk
Bought by
Sec Of Va
Create a Home Valuation Report for This Property
The Home Valuation Report is an in-depth analysis detailing your home's value as well as a comparison with similar homes in the area
Home Values in the Area
Average Home Value in this Area
Purchase History
| Date | Buyer | Sale Price | Title Company |
|---|---|---|---|
| Larumbe Jorge L | $146,900 | -- | |
| Fant Marcus S | $113,900 | -- | |
| Sec Of Va | -- | -- | |
| Union Planters Natl Bnk | $70,900 | -- |
Source: Public Records
Mortgage History
| Date | Status | Borrower | Loan Amount |
|---|---|---|---|
| Open | Larumbe Jorge L | $142,400 | |
| Previous Owner | Fant Marcus S | $112,935 |
Source: Public Records
Tax History Compared to Growth
Tax History
| Year | Tax Paid | Tax Assessment Tax Assessment Total Assessment is a certain percentage of the fair market value that is determined by local assessors to be the total taxable value of land and additions on the property. | Land | Improvement |
|---|---|---|---|---|
| 2025 | $3,351 | $149,760 | $25,840 | $123,920 |
| 2024 | $2,913 | $121,960 | $20,400 | $101,560 |
| 2023 | $2,913 | $121,960 | $20,400 | $101,560 |
| 2022 | $2,925 | $121,960 | $20,400 | $101,560 |
| 2021 | $1,982 | $73,880 | $14,120 | $59,760 |
| 2020 | $2,000 | $73,880 | $14,120 | $59,760 |
| 2019 | $2,437 | $65,680 | $12,800 | $52,880 |
| 2018 | $1,625 | $56,320 | $10,000 | $46,320 |
| 2016 | $1,627 | $56,320 | $10,000 | $46,320 |
| 2015 | $965 | $25,480 | $4,400 | $21,080 |
| 2014 | $668 | $25,480 | $4,400 | $21,080 |
Source: Public Records
Map
Nearby Homes
- 2199 Summertown Dr
- 2848 Wild Laurel Ct
- 724 Camelot Way
- 5645 Hammond Dr
- 5479 Windy Creek Ln
- 5457 Rails Way
- 5639 Chatham Cir
- 2375 Beaver Falls Dr
- 5766 Buford Hwy
- 5364 Hickory Knoll
- 5358 Beaver Branch
- 5357 Beaver Branch
- 5381 Station Cir Unit 3
- 392 Price Place NW
- 5341 Goodwick Way
- 5596 Buford Hwy
- 2009 Hoot Owl Trail
- 622 Summer Place
- 5670 Hollow Ridge Ln
- 2340 Beaver Ruin Rd Unit 26
- 2289 Marshes Glenn Dr
- 2301 Marshes Glenn Dr
- 2294 Marshes Glenn Dr
- 2300 Marshes Glenn Dr Unit 2
- 2307 Marshes Glenn Dr
- 58647 Executive Way
- 2283 Marshes Glenn Dr Unit 2
- 2306 Marshes Glenn Dr
- 2313 Marshes Glenn Dr Unit 1
- 2288 Marshes Glenn Dr Unit 2
- 2312 Marshes Glenn Dr
- 2277 Marshes Glenn Dr
- 2282 Marshes Glenn Dr
- 5812 Glenn Hollow Ln
- 5818 Glenn Hollow Ln
- 5720 Everglades Ln
- 5824 Glenn Hollow Ln Unit 4
- 2276 Marshes Glenn Dr Unit 2
- 2319 Marshes Glenn Dr
- 2271 Marshes Glenn Dr NW