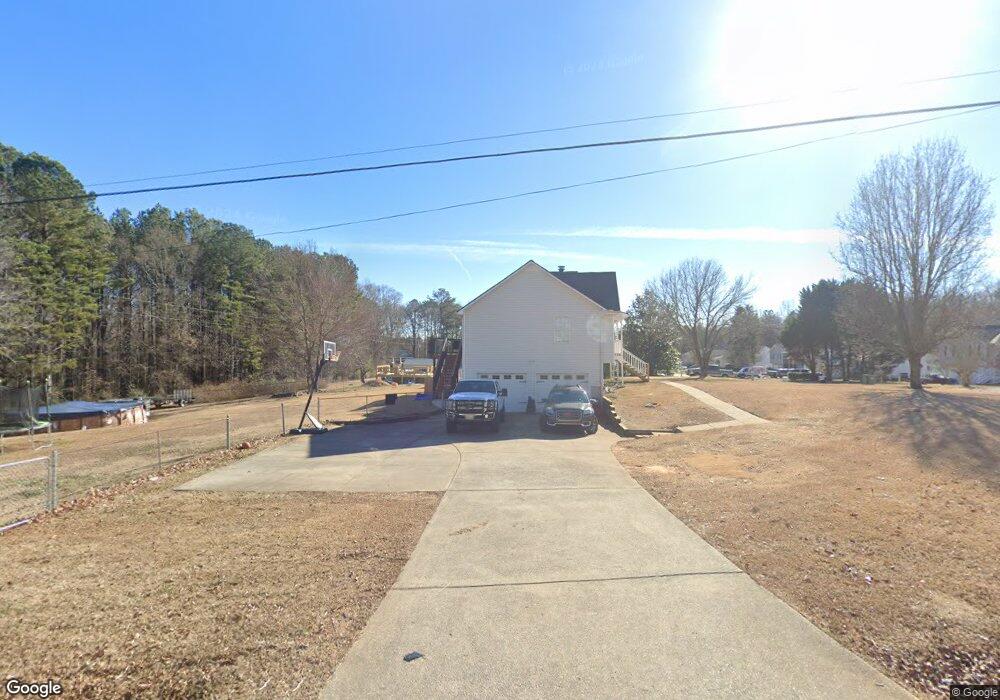
2295 Rainey Rd Temple, GA 30179
Estimated Value: $261,132 - $309,000
3
Beds
2
Baths
1,382
Sq Ft
$205/Sq Ft
Est. Value
About This Home
This home is located at 2295 Rainey Rd, Temple, GA 30179 and is currently estimated at $283,033, approximately $204 per square foot. 2295 Rainey Rd is a home located in Carroll County with nearby schools including Providence Elementary School, Temple Middle School, and Temple High School.
Ownership History
Date
Name
Owned For
Owner Type
Purchase Details
Closed on
Nov 17, 2021
Sold by
Bickford James
Bought by
Bickford James A and Bickford Robin A
Current Estimated Value
Home Financials for this Owner
Home Financials are based on the most recent Mortgage that was taken out on this home.
Original Mortgage
$137,000
Outstanding Balance
$124,563
Interest Rate
3.09%
Mortgage Type
New Conventional
Estimated Equity
$158,470
Purchase Details
Closed on
Nov 24, 2010
Sold by
Federal National Mortgage Association
Bought by
Bickford James
Home Financials for this Owner
Home Financials are based on the most recent Mortgage that was taken out on this home.
Original Mortgage
$65,803
Interest Rate
4.31%
Mortgage Type
New Conventional
Purchase Details
Closed on
Aug 3, 2010
Sold by
Cole Joey
Bought by
Bac Home Loans Servicing Lp
Purchase Details
Closed on
Sep 14, 1998
Sold by
Cole
Bought by
Cole Joey
Purchase Details
Closed on
Aug 4, 1998
Sold by
Cole Builders & Dev
Bought by
Cole Joey
Create a Home Valuation Report for This Property
The Home Valuation Report is an in-depth analysis detailing your home's value as well as a comparison with similar homes in the area
Home Values in the Area
Average Home Value in this Area
Purchase History
| Date | Buyer | Sale Price | Title Company |
|---|---|---|---|
| Bickford James A | -- | -- | |
| Bickford James | $50,000 | -- | |
| Bac Home Loans Servicing Lp | $79,500 | -- | |
| Cole Joey | -- | -- | |
| Cole Joey | $79,200 | -- |
Source: Public Records
Mortgage History
| Date | Status | Borrower | Loan Amount |
|---|---|---|---|
| Open | Bickford James A | $137,000 | |
| Previous Owner | Bickford James | $65,803 |
Source: Public Records
Tax History
| Year | Tax Paid | Tax Assessment Tax Assessment Total Assessment is a certain percentage of the fair market value that is determined by local assessors to be the total taxable value of land and additions on the property. | Land | Improvement |
|---|---|---|---|---|
| 2025 | $1,800 | $102,638 | $8,000 | $94,638 |
| 2024 | $1,821 | $102,638 | $8,000 | $94,638 |
| 2023 | $1,821 | $94,685 | $8,000 | $86,685 |
| 2022 | $1,546 | $77,560 | $8,000 | $69,560 |
| 2021 | $1,232 | $57,983 | $8,000 | $49,983 |
| 2020 | $1,139 | $52,736 | $8,000 | $44,736 |
| 2019 | $1,076 | $48,868 | $8,000 | $40,868 |
| 2018 | $992 | $43,485 | $8,000 | $35,485 |
| 2017 | $1,024 | $45,085 | $10,000 | $35,085 |
| 2016 | $1,024 | $45,085 | $10,000 | $35,085 |
| 2015 | $953 | $38,075 | $8,000 | $30,075 |
| 2014 | $957 | $38,075 | $8,000 | $30,075 |
Source: Public Records
Map
Nearby Homes
- 0 Old Draketown Trail Unit 10668385
- 0 Old Draketown Trail Unit 7700911
- 223 Sunlight Cove
- 100 Gordons Lake Dr
- 410 Nottely Dr
- 411 Nottely Dr
- 150 Charles Painter Rd
- 489 Bethany Woods Dr
- 329 Morgan Rd
- 217 Browning Rd
- 807 Old Draketown Pass
- 125 Meadowview Dr Unit 14
- 115 Meadowview Dr Unit 19
- 119 Meadowview Dr Unit 17
- 121 Meadowview Dr Unit 16
- 117 Meadowview Dr Unit 18
- 123 Meadowview Dr Unit 15
- 40 Holder Rd
- 169 Rachel Blvd
- 139 Clover Ct