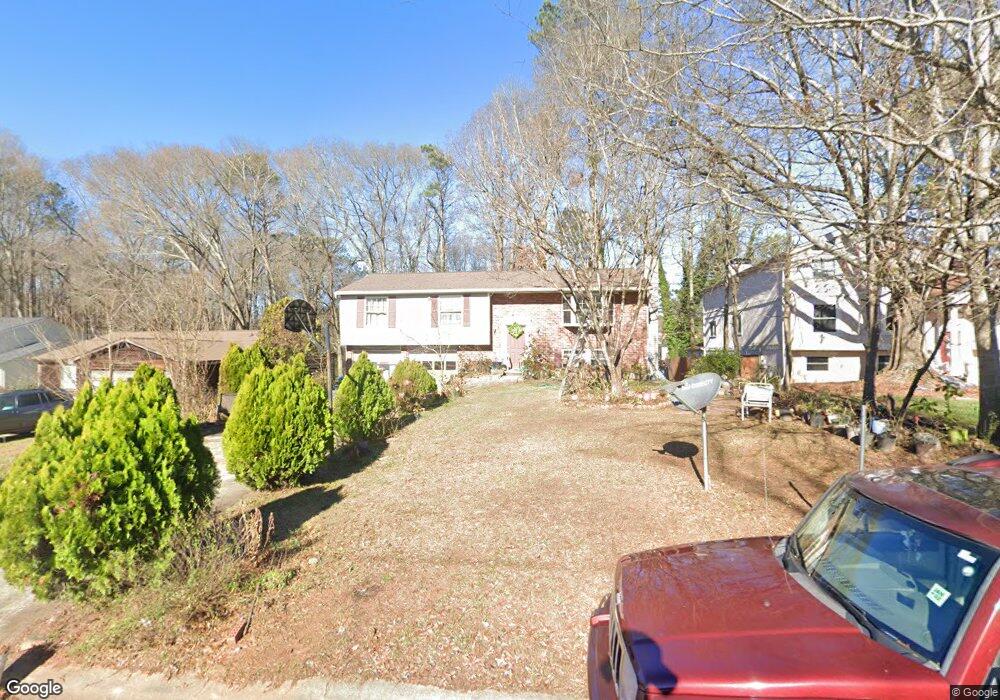
2295 Ranch Trail Unit 6 Norcross, GA 30071
Estimated Value: $322,000 - $367,000
3
Beds
3
Baths
1,296
Sq Ft
$273/Sq Ft
Est. Value
About This Home
This home is located at 2295 Ranch Trail Unit 6, Norcross, GA 30071 and is currently estimated at $353,439, approximately $272 per square foot. 2295 Ranch Trail Unit 6 is a home located in Gwinnett County with nearby schools including Beaver Ridge Elementary School, Summerour Middle School, and Norcross High School.
Ownership History
Date
Name
Owned For
Owner Type
Purchase Details
Closed on
Jul 16, 2021
Sold by
Dec31
Bought by
Gonzalez Jose A Vera
Current Estimated Value
Home Financials for this Owner
Home Financials are based on the most recent Mortgage that was taken out on this home.
Original Mortgage
$213,750
Outstanding Balance
$193,194
Interest Rate
2.93%
Mortgage Type
New Conventional
Estimated Equity
$160,245
Purchase Details
Closed on
Jan 4, 2021
Sold by
Greathouse Thomas Richard
Bought by
Dec31
Purchase Details
Closed on
Nov 2, 2018
Sold by
Greathouse Thomas
Bought by
Greathouse Thomas Richard
Home Financials for this Owner
Home Financials are based on the most recent Mortgage that was taken out on this home.
Original Mortgage
$105,000
Interest Rate
4.7%
Mortgage Type
New Conventional
Purchase Details
Closed on
Oct 2, 2002
Sold by
Household Realty Corp
Bought by
Greathouse Tom
Purchase Details
Closed on
Mar 5, 2002
Sold by
Tran Phuong T
Bought by
Household Rlty
Create a Home Valuation Report for This Property
The Home Valuation Report is an in-depth analysis detailing your home's value as well as a comparison with similar homes in the area
Home Values in the Area
Average Home Value in this Area
Purchase History
| Date | Buyer | Sale Price | Title Company |
|---|---|---|---|
| Gonzalez Jose A Vera | $225,000 | -- | |
| Dec31 | $225,000 | -- | |
| Greathouse Thomas Richard | -- | -- | |
| Greathouse Tom | $108,000 | -- | |
| Household Rlty | $122,200 | -- |
Source: Public Records
Mortgage History
| Date | Status | Borrower | Loan Amount |
|---|---|---|---|
| Open | Gonzalez Jose A Vera | $213,750 | |
| Previous Owner | Greathouse Thomas Richard | $105,000 |
Source: Public Records
Tax History
| Year | Tax Paid | Tax Assessment Tax Assessment Total Assessment is a certain percentage of the fair market value that is determined by local assessors to be the total taxable value of land and additions on the property. | Land | Improvement |
|---|---|---|---|---|
| 2025 | $5,956 | $159,080 | $25,840 | $133,240 |
| 2024 | $5,209 | $136,360 | $25,600 | $110,760 |
| 2023 | $5,209 | $136,360 | $25,600 | $110,760 |
| 2022 | $3,516 | $90,000 | $23,200 | $66,800 |
| 2021 | $3,453 | $87,080 | $18,400 | $68,680 |
| 2020 | $3,347 | $83,640 | $16,000 | $67,640 |
| 2019 | $3,225 | $83,640 | $16,000 | $67,640 |
| 2018 | $2,689 | $68,320 | $13,600 | $54,720 |
| 2016 | $2,318 | $57,240 | $11,200 | $46,040 |
| 2015 | $1,933 | $45,680 | $8,000 | $37,680 |
| 2014 | -- | $39,920 | $8,000 | $31,920 |
Source: Public Records
Map
Nearby Homes
- 5045 Racquet Ct
- 4880 Racquet Ct
- 4870 Racquet Ct
- 2325 E Hill Way NW
- 4935 Rockborough Trail NW
- 5041 Rockborough Trail Unit 3
- 4767 Glenwhite Dr
- 2621 Bailey Dr
- 4242 Morrison Lake Trail
- 2340 Beaver Ruin Rd Unit 26
- 2340 Beaver Ruin Rd Unit 41
- 2340 Beaver Ruin Rd
- 2340 Beaver Ruin Rd Unit 16
- 2340 Beaver Ruin Rd Unit 43
- 2340 Beaver Ruin Rd Unit 15
- 2340 Beaver Ruin Rd
- 2340 Beaver Ruin Rd Unit 4
- 5206 Westhill Dr NW
- 4945 Clara Mae Walk
- 2066 Pinnacle Pointe Dr
- 2301 Ranch Trail
- 2289 Ranch Trail
- 2283 Ranch Trail
- 2307 Ranch Trail
- 2292 Blacksmith Ct
- 2302 Ranch Trail
- 2296 Ranch Trail
- 2284 Ranch Trail Unit 6
- 2252 Blacksmith Ct
- 2304 Ranch Trail Unit 6
- 2313 Ranch Trail
- 2290 Ranch Trail
- 2277 Ranch Trail
- 2314 Ranch Trail
- 2278 Ranch Trail
- 2308 Ranch Trail Unit 28
- 2308 Ranch Trail
- 2262 Blacksmith Ct
- 2282 Blacksmith Ct
- 2303 Blacksmith Ct