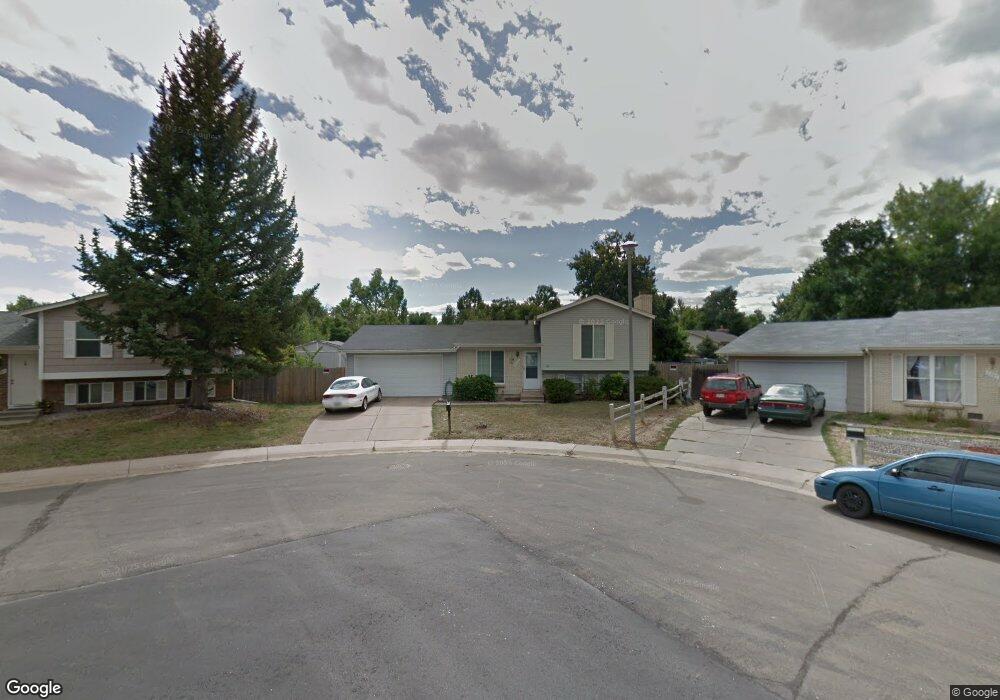
2295 S Norfolk St Aurora, CO 80013
Horseshoe Park NeighborhoodEstimated Value: $417,000 - $444,000
2
Beds
2
Baths
864
Sq Ft
$499/Sq Ft
Est. Value
About This Home
This home is located at 2295 S Norfolk St, Aurora, CO 80013 and is currently estimated at $430,910, approximately $498 per square foot. 2295 S Norfolk St is a home located in Arapahoe County with nearby schools including Yale Elementary School, Columbia Middle School, and Rangeview High School.
Ownership History
Date
Name
Owned For
Owner Type
Purchase Details
Closed on
May 26, 2017
Sold by
Johnson Josaph
Bought by
Johnson Joseph J and Johnson Charine L
Current Estimated Value
Home Financials for this Owner
Home Financials are based on the most recent Mortgage that was taken out on this home.
Original Mortgage
$213,750
Outstanding Balance
$178,280
Interest Rate
4.12%
Mortgage Type
Adjustable Rate Mortgage/ARM
Estimated Equity
$252,630
Purchase Details
Closed on
May 15, 2012
Sold by
Deutsche Bank Natonal Trust Company
Bought by
Johnson Joseph
Purchase Details
Closed on
Apr 13, 2012
Sold by
Correa Sandoval Campos Silvia P and Correa Cortez Genaro
Bought by
Deutsche Bank National Trust Company
Purchase Details
Closed on
Dec 21, 2004
Sold by
Graham Amanda D and Covarrubias Arthur
Bought by
Campos Silvia P Sandoval
Home Financials for this Owner
Home Financials are based on the most recent Mortgage that was taken out on this home.
Original Mortgage
$148,480
Interest Rate
5.76%
Mortgage Type
Purchase Money Mortgage
Purchase Details
Closed on
Oct 9, 2001
Sold by
Steele Bradley W and Steele Jill K
Bought by
Graham Amanda D and Covarrubias Arthur
Home Financials for this Owner
Home Financials are based on the most recent Mortgage that was taken out on this home.
Original Mortgage
$147,475
Interest Rate
7.15%
Purchase Details
Closed on
Aug 26, 1996
Sold by
Brodie Matthew Richard
Bought by
Steele Bradley W and Steele Jill K
Home Financials for this Owner
Home Financials are based on the most recent Mortgage that was taken out on this home.
Original Mortgage
$97,290
Interest Rate
8.27%
Mortgage Type
FHA
Purchase Details
Closed on
Aug 24, 1993
Sold by
Secretary Of Veterans Affairs 44 Union B
Bought by
Brodie Matthew Richard
Purchase Details
Closed on
Dec 21, 1992
Sold by
Kelly David Francis and Kelly Bonnie Jean
Bought by
Secretary Of Veterans Affairs 44 Union B
Purchase Details
Closed on
May 19, 1988
Sold by
Rempfer Ephraim
Bought by
Kelly David Francis and Kelly Bonnie Jean
Purchase Details
Closed on
Jan 14, 1988
Sold by
Secretary Of Housing & Urban Dev
Bought by
Rempfer Ephraim
Purchase Details
Closed on
Jul 6, 1987
Sold by
Conversion Arapco
Bought by
Secretary Of Housing & Urban Dev
Purchase Details
Closed on
Jul 1, 1981
Sold by
Conversion Arapco
Bought by
Conversion Arapco
Purchase Details
Closed on
Jul 4, 1776
Bought by
Conversion Arapco
Create a Home Valuation Report for This Property
The Home Valuation Report is an in-depth analysis detailing your home's value as well as a comparison with similar homes in the area
Home Values in the Area
Average Home Value in this Area
Purchase History
| Date | Buyer | Sale Price | Title Company |
|---|---|---|---|
| Johnson Joseph J | -- | None Available | |
| Johnson Joseph | $115,734 | None Available | |
| Deutsche Bank National Trust Company | -- | None Available | |
| Campos Silvia P Sandoval | $185,600 | Security Title | |
| Graham Amanda D | $173,500 | Guardian Title Agency Llc | |
| Steele Bradley W | $98,000 | North American Title | |
| Brodie Matthew Richard | -- | -- | |
| Secretary Of Veterans Affairs 44 Union B | -- | -- | |
| Kelly David Francis | -- | -- | |
| Rempfer Ephraim | -- | -- | |
| Secretary Of Housing & Urban Dev | -- | -- | |
| Conversion Arapco | -- | -- | |
| Conversion Arapco | -- | -- |
Source: Public Records
Mortgage History
| Date | Status | Borrower | Loan Amount |
|---|---|---|---|
| Open | Johnson Joseph J | $213,750 | |
| Previous Owner | Campos Silvia P Sandoval | $148,480 | |
| Previous Owner | Graham Amanda D | $147,475 | |
| Previous Owner | Steele Bradley W | $97,290 | |
| Closed | Graham Amanda D | $26,025 | |
| Closed | Campos Silvia P Sandoval | $37,120 |
Source: Public Records
Tax History Compared to Growth
Tax History
| Year | Tax Paid | Tax Assessment Tax Assessment Total Assessment is a certain percentage of the fair market value that is determined by local assessors to be the total taxable value of land and additions on the property. | Land | Improvement |
|---|---|---|---|---|
| 2024 | $2,666 | $28,683 | -- | -- |
| 2023 | $2,666 | $28,683 | $0 | $0 |
| 2022 | $2,302 | $22,921 | $0 | $0 |
| 2021 | $2,376 | $22,921 | $0 | $0 |
| 2020 | $2,433 | $23,367 | $0 | $0 |
| 2019 | $2,420 | $23,367 | $0 | $0 |
| 2018 | $1,963 | $18,568 | $0 | $0 |
| 2017 | $1,708 | $18,568 | $0 | $0 |
| 2016 | $1,318 | $14,026 | $0 | $0 |
| 2015 | $1,272 | $14,026 | $0 | $0 |
| 2014 | $851 | $9,035 | $0 | $0 |
| 2013 | -- | $12,040 | $0 | $0 |
Source: Public Records
Map
Nearby Homes
- 2463 S Memphis Way
- 16026 E Warren Place
- 2497 S Mobile St
- 16497 E Vassar Ave
- 2145 S Lewiston St
- 16570 E Lasalle Place
- 2215 S Buckley Rd Unit 201
- 2493 S Kalispell Cir
- 2615 S Laredo Ct
- 2150 S Idalia St
- 2139 S Ouray St
- 16622 E Asbury Ave
- 15532 E Pacific Place
- 2822 S Mobile St
- 15512 E Pacific Place
- 15671 E Atlantic Cir
- 2832 S Mobile St
- 16836 E Asbury Ave
- 2082 S Helena St Unit A
- 1996 S Olathe St
- 16502 E Iliff Place
- 2287 S Norfolk St
- 2282 S Memphis St
- 2292 S Memphis St
- 2272 S Memphis St
- 16522 E Iliff Place
- 2285 S Norfolk St
- 2262 S Memphis St
- 2286 S Norfolk St
- 16507 E Wesley Ave
- 2275 S Norfolk St
- 16515 E Wesley Ave
- 16521 E Iliff Place
- 2291 S Memphis St
- 2252 S Memphis St
- 16505 E Wesley Ave
- 16517 E Wesley Ave
- 2300 S Lewiston St
- 2281 S Memphis St
- 2276 S Norfolk St