C
Landlord's Agent in 2017
C. Lee Cook
Weichert Corporate
Estimated Value: $485,816 - $500,000
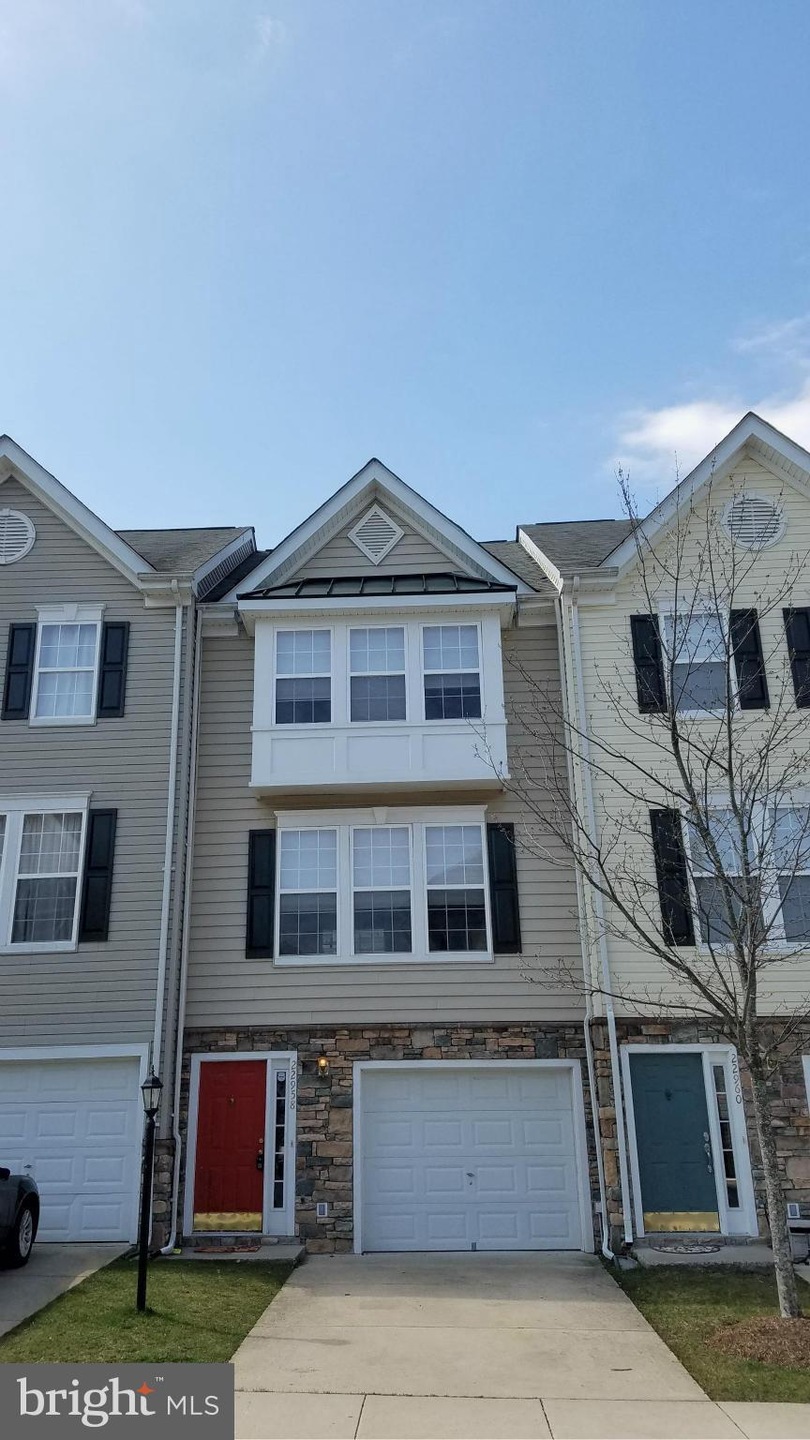
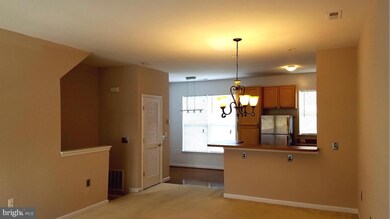
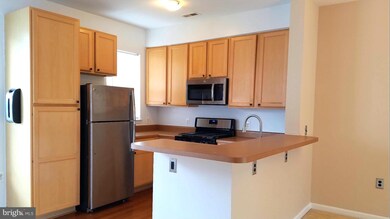
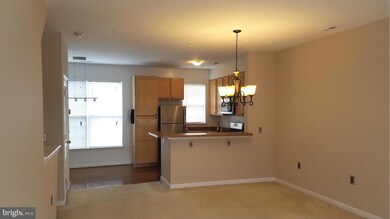
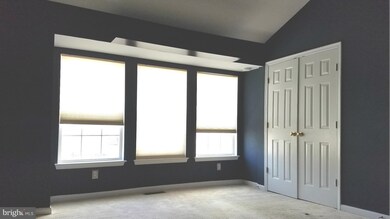
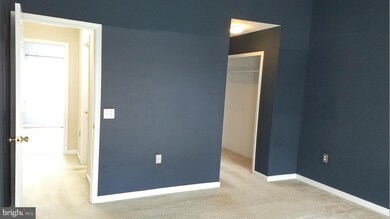
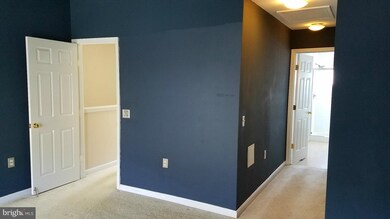
WOW!! IMMACULATE 3 LEVEL , 3 FULL BATH TOWNHOUSE**GARAGE w/ OPENER**OFF STREET & DRIVEWAY PARKING**NEARBY GUEST PARKING**UPDATED KITCHEN & APPLIANCES**INCLUDES SEPARATE WASHER & DRYER**LOWER LEVEL 3rd BDRM W/FULL BA & PRIVATE ENTRANCE**NEAR LARGE COMMON AREA**SWIMMING POOL & PLAY AREA**CLOSE TO SHOPPING & MAJOR ROADWAYS, NEARBY DULLES AP**MUCH MORE**MUST SEE**
Last Agent to Rent the Property
C. Lee Cook
lcook41@aol.com Weichert, REALTORS Listed on: 04/04/2017
| Date | Buyer | Sale Price | Title Company |
|---|---|---|---|
| Rademaker Richard A | $200,000 | -- | |
| Samnang Nady | $329,900 | -- |
| Date | Status | Borrower | Loan Amount |
|---|---|---|---|
| Open | Rademaker Richard A | $196,350 | |
| Previous Owner | Samnang Nady | $263,920 |
| Date | Event | Price | List to Sale | Price per Sq Ft |
|---|---|---|---|---|
| 05/23/2017 05/23/17 | Rented | $1,800 | 0.0% | -- |
| 05/10/2017 05/10/17 | Under Contract | -- | -- | -- |
| 04/04/2017 04/04/17 | For Rent | $1,800 | +4.3% | -- |
| 06/17/2014 06/17/14 | Rented | $1,725 | -3.9% | -- |
| 06/10/2014 06/10/14 | Under Contract | -- | -- | -- |
| 05/11/2014 05/11/14 | For Rent | $1,795 | -- | -- |
| Year | Tax Paid | Tax Assessment Tax Assessment Total Assessment is a certain percentage of the fair market value that is determined by local assessors to be the total taxable value of land and additions on the property. | Land | Improvement |
|---|---|---|---|---|
| 2025 | $3,749 | $465,700 | $140,000 | $325,700 |
| 2024 | $3,751 | $433,620 | $140,000 | $293,620 |
| 2023 | $3,732 | $426,560 | $140,000 | $286,560 |
| 2022 | $3,646 | $409,620 | $120,000 | $289,620 |
| 2021 | $3,624 | $369,810 | $110,000 | $259,810 |
| 2020 | $3,545 | $342,530 | $100,000 | $242,530 |
| 2019 | $3,247 | $310,670 | $85,000 | $225,670 |
| 2018 | $3,100 | $285,700 | $85,000 | $200,700 |
| 2017 | $3,143 | $279,400 | $85,000 | $194,400 |
| 2016 | $3,204 | $279,800 | $0 | $0 |
| 2015 | $3,392 | $213,840 | $0 | $213,840 |
| 2014 | $3,058 | $179,790 | $0 | $179,790 |
C
Landlord's Agent in 2017
C. Lee Cook
Weichert Corporate
H
Tenant's Agent in 2017
Helen Manning
National Realty, LLC
(703) 864-4346
Source: Bright MLS
MLS Number: 1000726197
APN: 024-25-1383-007
Disclaimer: Certain information contained herein is derived from information provided by parties other than Homes.com. All information provided is deemed reliable, but is not guaranteed to be accurate and should be independently verified.
![]() The data relating to real estate for sale on this website appears in part through the BRIGHT Internet Data Exchange program, a voluntary cooperative exchange of property listing data between licensed real estate brokerage firms, and is provided by BRIGHT through a licensing agreement.
The data relating to real estate for sale on this website appears in part through the BRIGHT Internet Data Exchange program, a voluntary cooperative exchange of property listing data between licensed real estate brokerage firms, and is provided by BRIGHT through a licensing agreement.
Listing information is from various brokers who participate in the Bright MLS IDX program and not all listings may be visible on the site.
The property information being provided on or through the website is for the personal, non-commercial use of consumers and such information may not be used for any purpose other than to identify prospective properties consumers may be interested in purchasing.
Some properties which appear for sale on the website may no longer be available because they are for instance, under contract, sold or are no longer being offered for sale.
Property information displayed is deemed reliable but is not guaranteed.
Copyright 2025 Bright MLS, Inc.
