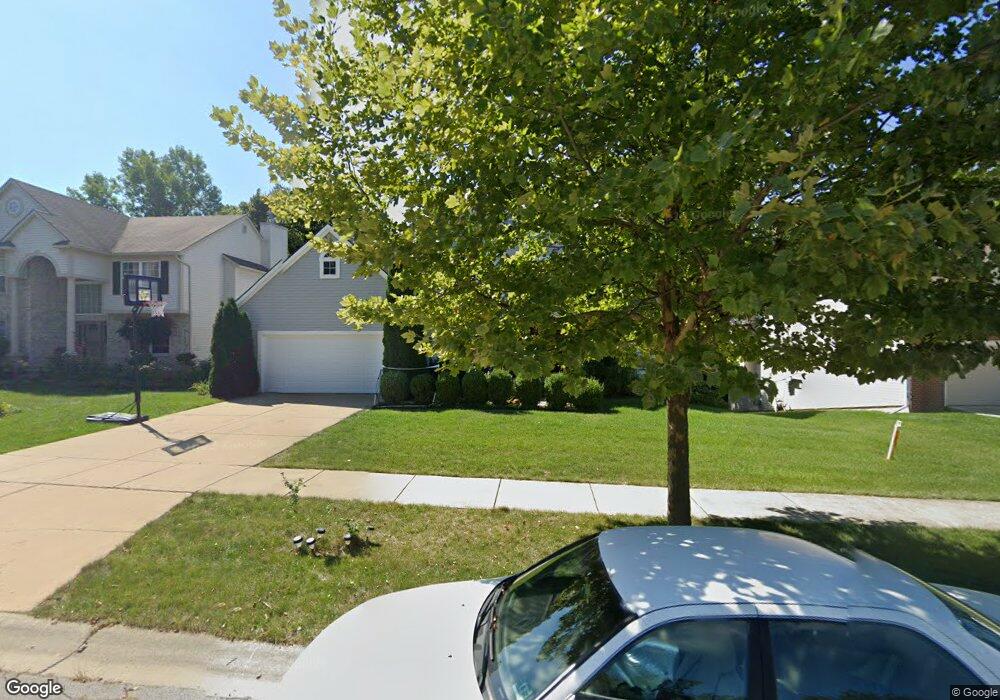
2296 Hickory Point Dr Unit 298 Ann Arbor, MI 48105
Northern Ann Arbor NeighborhoodEstimated Value: $633,000 - $653,000
4
Beds
1
Bath
2,100
Sq Ft
$304/Sq Ft
Est. Value
About This Home
This home is located at 2296 Hickory Point Dr Unit 298, Ann Arbor, MI 48105 and is currently estimated at $639,156, approximately $304 per square foot. 2296 Hickory Point Dr Unit 298 is a home located in Washtenaw County with nearby schools including Logan Elementary School, Clague Middle School, and Skyline High School.
Ownership History
Date
Name
Owned For
Owner Type
Purchase Details
Closed on
Sep 22, 2008
Sold by
Federal Home Loan Mortgage Corporation
Bought by
Zhang Dongqi and Gu Haoyu
Current Estimated Value
Home Financials for this Owner
Home Financials are based on the most recent Mortgage that was taken out on this home.
Original Mortgage
$176,250
Interest Rate
6.41%
Mortgage Type
Unknown
Purchase Details
Closed on
May 8, 2008
Sold by
Stewart William T and Stewart Margaret M
Bought by
Federal Home Loan Mortgage Corporation
Purchase Details
Closed on
Jun 28, 2005
Sold by
Guenther Building Co
Bought by
Stewart William T and Stewart Margaret M
Home Financials for this Owner
Home Financials are based on the most recent Mortgage that was taken out on this home.
Original Mortgage
$311,132
Interest Rate
5.5%
Mortgage Type
Fannie Mae Freddie Mac
Create a Home Valuation Report for This Property
The Home Valuation Report is an in-depth analysis detailing your home's value as well as a comparison with similar homes in the area
Home Values in the Area
Average Home Value in this Area
Purchase History
| Date | Buyer | Sale Price | Title Company |
|---|---|---|---|
| Zhang Dongqi | $235,000 | Warrenty Title | |
| Federal Home Loan Mortgage Corporation | $321,526 | None Available | |
| Stewart William T | $388,915 | Atc |
Source: Public Records
Mortgage History
| Date | Status | Borrower | Loan Amount |
|---|---|---|---|
| Closed | Zhang Dongqi | $176,250 | |
| Previous Owner | Stewart William T | $311,132 |
Source: Public Records
Tax History Compared to Growth
Tax History
| Year | Tax Paid | Tax Assessment Tax Assessment Total Assessment is a certain percentage of the fair market value that is determined by local assessors to be the total taxable value of land and additions on the property. | Land | Improvement |
|---|---|---|---|---|
| 2025 | $9,706 | $309,600 | $0 | $0 |
| 2024 | $9,467 | $297,600 | $0 | $0 |
| 2023 | $8,729 | $286,700 | $0 | $0 |
| 2022 | $9,512 | $265,600 | $0 | $0 |
| 2021 | $9,288 | $263,800 | $0 | $0 |
| 2020 | $9,100 | $239,400 | $0 | $0 |
| 2019 | $8,661 | $225,100 | $225,100 | $0 |
| 2018 | $10,933 | $211,100 | $0 | $0 |
| 2017 | $10,547 | $205,600 | $0 | $0 |
| 2016 | $10,277 | $166,097 | $0 | $0 |
| 2015 | $7,632 | $165,601 | $0 | $0 |
| 2014 | $7,632 | $160,428 | $0 | $0 |
| 2013 | -- | $160,428 | $0 | $0 |
Source: Public Records
Map
Nearby Homes
- 3126 Fairhaven Ct
- 3636 N Territorial Rd E
- 3500 Pontiac Trail
- 3341 Roseford Blvd
- 2678 S Knightsbridge Cir Unit 24
- 3056 N Spurway Dr
- 3090 N Spurway Dr
- 2805 Rathmore Ln
- 3100 Millbury Ln
- 3250 Brackley Dr
- 3095 Millbury Ln
- 2768 S Knightsbridge Cir
- 2776 Bristol Ridge Dr Unit 37
- 2772 Bristol Ridge Dr Unit 35
- 2774 Bristol Ridge Dr Unit 36
- 2778 Bristol Ridge Dr Unit 38
- 2994 Montana Way
- 2793 Bristol Ridge Dr Unit 45
- 2901 Corston Rd
- 2877 Rayfield Ave
- 2294 Hickory Point Dr Unit 299
- 2298 Hickory Point Dr Unit 297
- 2292 Hickory Point Dr Unit 300
- 3161 Birchwood Dr
- 2299 Hickory Point Dr Unit 355
- 2290 Hickory Point Dr
- 3159 Birchwood Dr
- 3169 Birchwood Ct Unit 229
- 3170 Redland Ct
- 2288 Hickory Point Dr Unit 302
- 2266 Hickory Point Dr
- 3173 Redland Ct Unit 354
- 2330 Hickory Point Dr
- 3175 Birchwood Ct
- 2268 Hickory Point Dr Unit 311
- 2286 Hickory Point Dr Unit 303
- 3153 Birchwood Dr
- 2270 Hickory Point Dr Unit 310
- 3172 Redland Ct Unit 351
- 0 Birchwood Ct