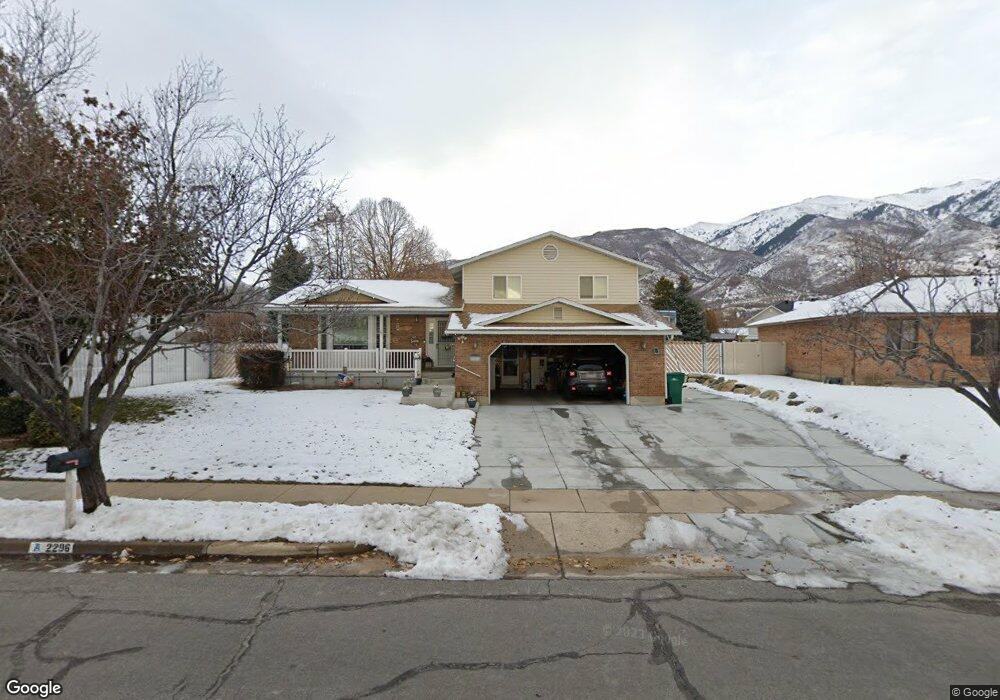
2296 N 2275 E Layton, UT 84040
Estimated Value: $568,000 - $622,000
5
Beds
3
Baths
2,870
Sq Ft
$203/Sq Ft
Est. Value
About This Home
This home is located at 2296 N 2275 E, Layton, UT 84040 and is currently estimated at $582,798, approximately $203 per square foot. 2296 N 2275 E is a home located in Davis County with nearby schools including Sarah Jane Adams Elementary School, North Layton Junior High School, and Northridge High School.
Ownership History
Date
Name
Owned For
Owner Type
Purchase Details
Closed on
Mar 28, 2003
Sold by
Hall Jeffrey M and Harper Barbara R
Bought by
Hall Jeffrey M and Hall Barbara R
Current Estimated Value
Purchase Details
Closed on
Jul 31, 2002
Sold by
Evans Ryan N and Evans Elisa E
Bought by
Hall Jeffrey M and Harper Barbara R
Home Financials for this Owner
Home Financials are based on the most recent Mortgage that was taken out on this home.
Original Mortgage
$179,520
Outstanding Balance
$75,508
Interest Rate
6.6%
Mortgage Type
VA
Estimated Equity
$507,290
Purchase Details
Closed on
May 31, 1996
Sold by
Coburn Pamala A F and Riding Douglas W
Bought by
Evans Ryan N and Evans Elisa E
Home Financials for this Owner
Home Financials are based on the most recent Mortgage that was taken out on this home.
Original Mortgage
$150,550
Interest Rate
7.97%
Create a Home Valuation Report for This Property
The Home Valuation Report is an in-depth analysis detailing your home's value as well as a comparison with similar homes in the area
Home Values in the Area
Average Home Value in this Area
Purchase History
| Date | Buyer | Sale Price | Title Company |
|---|---|---|---|
| Hall Jeffrey M | -- | Bonneville Title Company Inc | |
| Hall Jeffrey M | -- | Bonneville Title Company Inc | |
| Evans Ryan N | -- | Old Republic Title Company |
Source: Public Records
Mortgage History
| Date | Status | Borrower | Loan Amount |
|---|---|---|---|
| Open | Hall Jeffrey M | $179,520 | |
| Previous Owner | Evans Ryan N | $150,550 |
Source: Public Records
Tax History
| Year | Tax Paid | Tax Assessment Tax Assessment Total Assessment is a certain percentage of the fair market value that is determined by local assessors to be the total taxable value of land and additions on the property. | Land | Improvement |
|---|---|---|---|---|
| 2025 | $183 | $279,400 | $123,792 | $155,608 |
| 2024 | $315 | $268,950 | $147,746 | $121,204 |
| 2023 | $312 | $468,000 | $199,490 | $268,510 |
| 2022 | $1,934 | $267,850 | $106,981 | $160,869 |
| 2021 | $1,516 | $361,000 | $162,775 | $198,225 |
| 2020 | $1,264 | $315,000 | $131,643 | $183,357 |
| 2019 | $1,222 | $305,000 | $117,631 | $187,369 |
| 2018 | $1,034 | $277,000 | $91,447 | $185,553 |
| 2016 | $785 | $129,525 | $48,158 | $81,367 |
| 2015 | $1,766 | $119,790 | $48,158 | $71,632 |
| 2014 | $700 | $121,446 | $48,158 | $73,288 |
| 2013 | -- | $109,134 | $25,032 | $84,102 |
Source: Public Records
Map
Nearby Homes
- 2340 N 2050 E
- 2273 N 1975 E
- 2563 E 2250 N
- 2597 N 2300 E
- 1907 N Bridge Ct
- 2509 E 1900 N
- 2547 E 1900 N
- 1954 N 2600 E
- 2189 N 1950 E
- 2136 N 2800 E
- 2391 Kays Creek Dr
- 2353 Canyon View Dr
- 3142 E Thorley Dr
- 3138 E Thorley Dr
- 2569 N 2900 E
- 1935 Deere Valley Dr
- 1843 Hayes Dr
- 1911 Deere Valley Dr
- 1785 E 2825 N
- 1731 E 2825 N
Your Personal Tour Guide
Ask me questions while you tour the home.