Estimated Value: $342,000 - $386,000
4
Beds
2
Baths
900
Sq Ft
$403/Sq Ft
Est. Value
About This Home
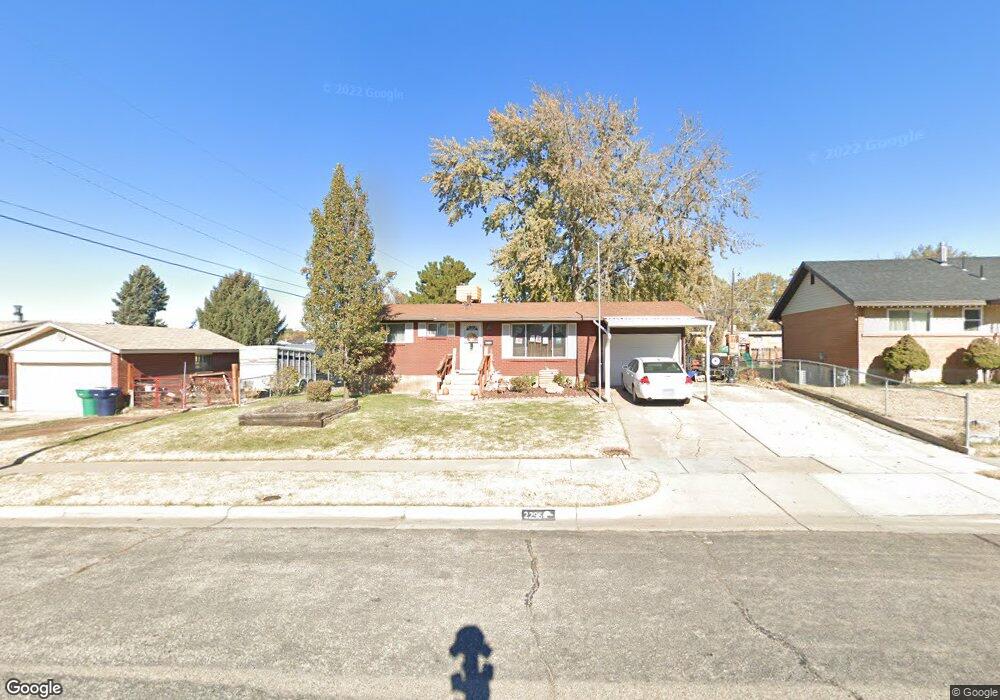
This home is located at 2296 W 5950 S, Roy, UT 84067 and is currently estimated at $363,114, approximately $403 per square foot. 2296 W 5950 S is a home located in Weber County with nearby schools including Municipal School, Roy Junior High School, and Roy High School.
Ownership History
Date
Name
Owned For
Owner Type
Purchase Details
Closed on
Jul 9, 2003
Sold by
Whittier M Christian
Bought by
Strong Weston P
Current Estimated Value
Purchase Details
Closed on
Dec 16, 2002
Sold by
Va
Bought by
Whittier M Christian
Home Financials for this Owner
Home Financials are based on the most recent Mortgage that was taken out on this home.
Original Mortgage
$77,900
Interest Rate
6.06%
Mortgage Type
VA
Purchase Details
Closed on
Sep 17, 2002
Sold by
Clegg Gary and United Security Financial
Bought by
Chase Manhattan Mtg Corp
Purchase Details
Closed on
Sep 11, 2002
Sold by
Chase Manhattan Mtg Corp
Bought by
Va
Purchase Details
Closed on
May 28, 1997
Sold by
Wright Steven James and Wright Carrie E
Bought by
Clegg Gary
Home Financials for this Owner
Home Financials are based on the most recent Mortgage that was taken out on this home.
Original Mortgage
$98,000
Interest Rate
8.13%
Mortgage Type
VA
Create a Home Valuation Report for This Property
The Home Valuation Report is an in-depth analysis detailing your home's value as well as a comparison with similar homes in the area
Home Values in the Area
Average Home Value in this Area
Purchase History
| Date | Buyer | Sale Price | Title Company |
|---|---|---|---|
| Strong Weston P | -- | Intermountain Title | |
| Whittier M Christian | -- | -- | |
| Chase Manhattan Mtg Corp | $88,130 | Backman Stewart Title | |
| Va | -- | Backman Stewart Title | |
| Clegg Gary | -- | Backman Stewart Title |
Source: Public Records
Mortgage History
| Date | Status | Borrower | Loan Amount |
|---|---|---|---|
| Previous Owner | Whittier M Christian | $77,900 | |
| Previous Owner | Clegg Gary | $98,000 |
Source: Public Records
Tax History
| Year | Tax Paid | Tax Assessment Tax Assessment Total Assessment is a certain percentage of the fair market value that is determined by local assessors to be the total taxable value of land and additions on the property. | Land | Improvement |
|---|---|---|---|---|
| 2025 | $2,125 | $326,835 | $127,731 | $199,104 |
| 2024 | $2,089 | $178,199 | $70,260 | $107,939 |
| 2023 | $2,083 | $178,750 | $64,239 | $114,511 |
| 2022 | $2,177 | $193,600 | $55,729 | $137,871 |
| 2021 | $1,696 | $245,000 | $71,154 | $173,846 |
| 2020 | $1,616 | $215,000 | $71,154 | $143,846 |
| 2019 | $1,671 | $211,000 | $40,995 | $170,005 |
| 2018 | $1,556 | $184,000 | $38,976 | $145,024 |
| 2017 | $1,356 | $148,000 | $35,927 | $112,073 |
| 2016 | $1,372 | $81,097 | $17,548 | $63,549 |
| 2015 | $1,202 | $71,760 | $17,548 | $54,212 |
| 2014 | $1,175 | $69,177 | $17,548 | $51,629 |
Source: Public Records
Map
Nearby Homes
- 2284 W 5950 S
- 5936 S 2325 W
- 2318 W 5950 S
- 2278 W 5950 S
- 5920 S 2325 W
- 2287 W 5900 S
- 2275 W 5900 S
- 2270 W 5950 S
- 2291 W 5950 S
- 2315 W 5950 S
- 2285 W 5950 S Unit Basement
- 2285 W 5950 S Unit 1
- 2285 W 5950 S Unit 2
- 2285 W 5950 S
- 2265 W 5900 S
- 5960 S 2325 W
- 2262 W 5950 S
- 5947 S 2325 W
- 5929 S 2325 W
- 2255 W 5900 S
Your Personal Tour Guide
Ask me questions while you tour the home.