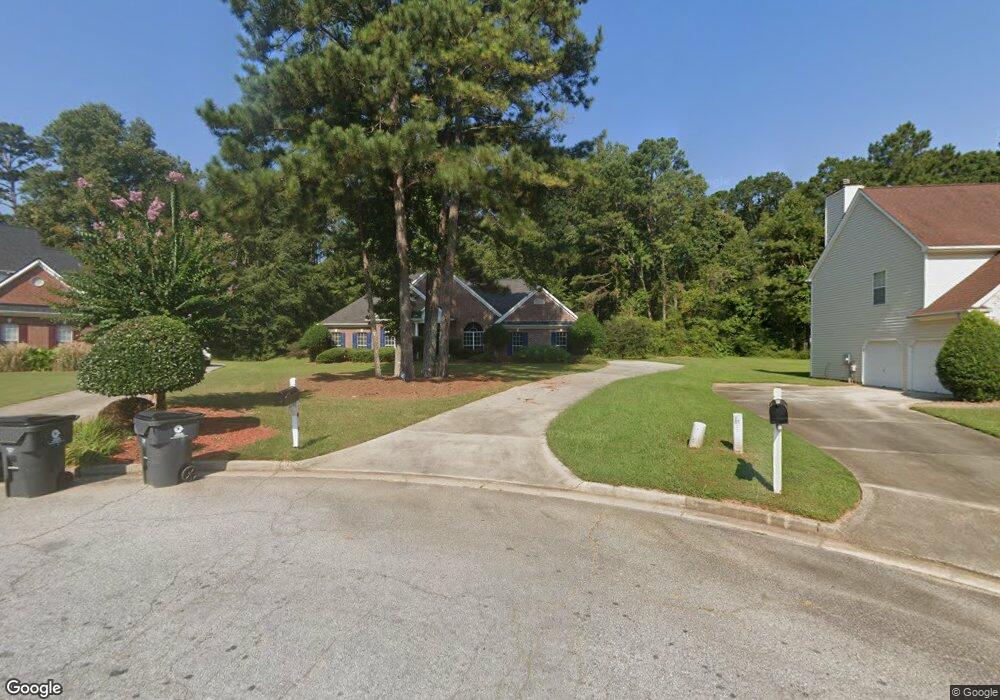
2297 Talbot Ridge Unit XXA Jonesboro, GA 30236
Estimated Value: $325,290 - $384,000
3
Beds
3
Baths
2,278
Sq Ft
$160/Sq Ft
Est. Value
About This Home
This home is located at 2297 Talbot Ridge Unit XXA, Jonesboro, GA 30236 and is currently estimated at $365,573, approximately $160 per square foot. 2297 Talbot Ridge Unit XXA is a home located in Clayton County with nearby schools including Suder Elementary School, M. D. Roberts Middle School, and Jonesboro High School.
Ownership History
Date
Name
Owned For
Owner Type
Purchase Details
Closed on
Apr 30, 2002
Sold by
Kirkwood Sharon D
Bought by
Kirkwood Sharon D
Current Estimated Value
Home Financials for this Owner
Home Financials are based on the most recent Mortgage that was taken out on this home.
Original Mortgage
$175,750
Outstanding Balance
$74,674
Interest Rate
7.16%
Mortgage Type
New Conventional
Estimated Equity
$290,899
Purchase Details
Closed on
Apr 20, 2002
Sold by
Cosby Vennis D and Cosby Leonard A
Bought by
Kirkwood Sharon D
Home Financials for this Owner
Home Financials are based on the most recent Mortgage that was taken out on this home.
Original Mortgage
$175,750
Outstanding Balance
$74,674
Interest Rate
7.16%
Mortgage Type
New Conventional
Estimated Equity
$290,899
Purchase Details
Closed on
Sep 30, 1998
Sold by
John Wieland Homes
Bought by
Cosby Vennis D and Cosby Leonard A
Home Financials for this Owner
Home Financials are based on the most recent Mortgage that was taken out on this home.
Original Mortgage
$186,300
Interest Rate
6.47%
Mortgage Type
VA
Create a Home Valuation Report for This Property
The Home Valuation Report is an in-depth analysis detailing your home's value as well as a comparison with similar homes in the area
Home Values in the Area
Average Home Value in this Area
Purchase History
| Date | Buyer | Sale Price | Title Company |
|---|---|---|---|
| Kirkwood Sharon D | -- | -- | |
| Kirkwood Sharon D | $185,000 | -- | |
| Cosby Vennis D | $181,700 | -- |
Source: Public Records
Mortgage History
| Date | Status | Borrower | Loan Amount |
|---|---|---|---|
| Open | Kirkwood Sharon D | $175,750 | |
| Previous Owner | Cosby Vennis D | $186,300 |
Source: Public Records
Tax History Compared to Growth
Tax History
| Year | Tax Paid | Tax Assessment Tax Assessment Total Assessment is a certain percentage of the fair market value that is determined by local assessors to be the total taxable value of land and additions on the property. | Land | Improvement |
|---|---|---|---|---|
| 2024 | $5,971 | $152,080 | $9,600 | $142,480 |
| 2023 | $5,263 | $145,760 | $9,600 | $136,160 |
| 2022 | $4,956 | $125,320 | $9,600 | $115,720 |
| 2021 | $3,588 | $89,880 | $9,600 | $80,280 |
| 2020 | $3,452 | $85,356 | $9,600 | $75,756 |
| 2019 | $3,357 | $81,749 | $9,600 | $72,149 |
| 2018 | $3,167 | $77,066 | $9,600 | $67,466 |
| 2017 | $2,710 | $65,677 | $9,600 | $56,077 |
| 2016 | $2,635 | $63,828 | $9,600 | $54,228 |
| 2015 | $2,482 | $0 | $0 | $0 |
| 2014 | $1,953 | $48,142 | $9,600 | $38,542 |
Source: Public Records
Map
Nearby Homes
- 0 Carnes Rd Unit 7665396
- 2328 Carnes Rd
- 9163 Retreat Pass
- 2330 Lago Dr
- 2345 Lake Jodeco Rd
- 2444 Quentin Dr
- 9261 Glenleigh Way
- 2316 Emerald Dr
- 9344 Hidden Hollow Trail
- 2519 Quentin Dr
- 2508 Quentin Dr
- 2461 Creekside Trace
- 9260 Betony Wood Trail
- 2544 Carnes Rd
- 9342 Carillon Ct
- 2270 Emerald Dr
- 9361 Arbor Glen Ct Unit 13
- 2484 Emerald Dr
- 2506 Emerald Dr
- 9396 Fairfield Pkwy
- 2301 Talbot Ridge Unit 20
- 2287 Talbot Ridge Unit XXA
- 2271 Talbot Ridge Unit XXA
- 9190 Retreat Pass Unit 12
- 2263 Talbot Ridge Unit XXA
- 9184 Retreat Pass
- 2245 Reserve Cir Unit 20
- 2255 Talbot Ridge
- 9202 Retreat Pass Unit 12
- 2300 Talbot Ridge
- 2296 Talbot Ridge Unit XXA
- 2247 Talbot Ridge
- 9180 Retreat Pass
- 2290 Talbot Ridge
- 9214 Retreat Pass
- 2284 Talbot Ridge Unit XXA
- 2239 Talbot Ridge
- 2260 Talbot Ridge Unit XXA
- 2276 Talbot Ridge
- 2252 Talbot Ridge