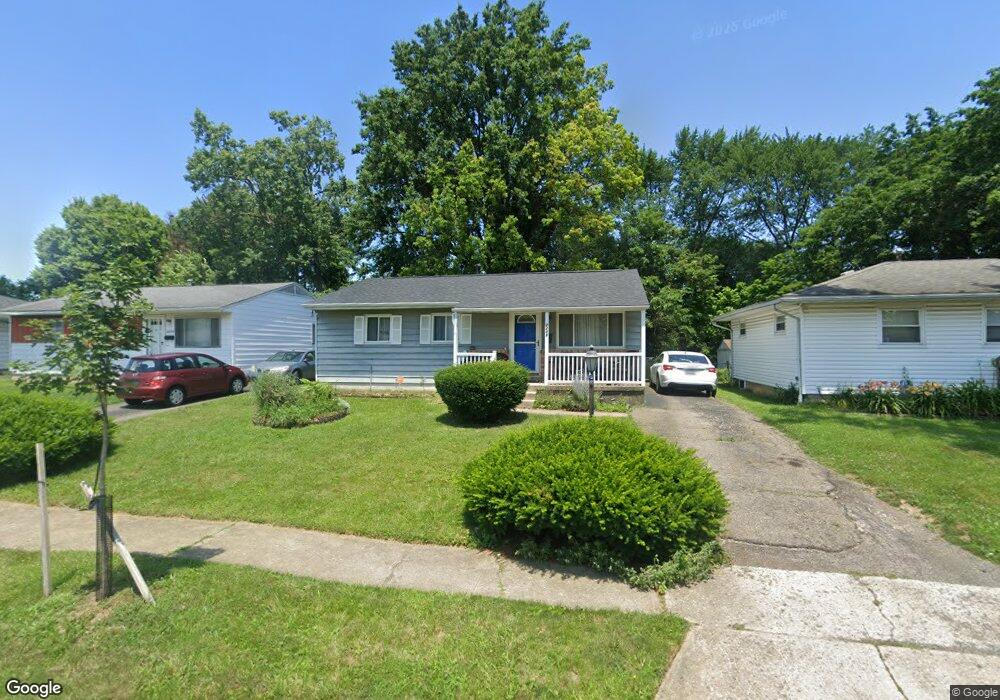
2298 Ward Rd Columbus, OH 43224
North Linden NeighborhoodEstimated Value: $161,577 - $219,000
3
Beds
2
Baths
936
Sq Ft
$198/Sq Ft
Est. Value
About This Home
This home is located at 2298 Ward Rd, Columbus, OH 43224 and is currently estimated at $185,394, approximately $198 per square foot. 2298 Ward Rd is a home located in Franklin County with nearby schools including North Linden Elementary School, Medina Middle School, and Mifflin High School.
Ownership History
Date
Name
Owned For
Owner Type
Purchase Details
Closed on
Sep 5, 2025
Sold by
Harris Latalia N and Mccoy Kevin
Bought by
Mccoy Kevin and Harris Latalia N
Current Estimated Value
Home Financials for this Owner
Home Financials are based on the most recent Mortgage that was taken out on this home.
Original Mortgage
$40,000
Outstanding Balance
$40,000
Interest Rate
6.72%
Mortgage Type
Credit Line Revolving
Estimated Equity
$145,394
Purchase Details
Closed on
Apr 18, 2003
Sold by
Case Brenda and Estate Of Peggy Sue Mullis
Bought by
Harris Latalia N
Home Financials for this Owner
Home Financials are based on the most recent Mortgage that was taken out on this home.
Original Mortgage
$80,500
Interest Rate
5.86%
Mortgage Type
Purchase Money Mortgage
Purchase Details
Closed on
Apr 25, 2000
Sold by
Rinehart Darci
Bought by
Mullis Peggy
Home Financials for this Owner
Home Financials are based on the most recent Mortgage that was taken out on this home.
Original Mortgage
$61,600
Interest Rate
8.24%
Purchase Details
Closed on
Dec 6, 1999
Sold by
Estate Of Julia A Tschumper
Bought by
Rinehart Darci
Purchase Details
Closed on
Sep 18, 1964
Bought by
Studabaker Julia A
Create a Home Valuation Report for This Property
The Home Valuation Report is an in-depth analysis detailing your home's value as well as a comparison with similar homes in the area
Home Values in the Area
Average Home Value in this Area
Purchase History
| Date | Buyer | Sale Price | Title Company |
|---|---|---|---|
| Mccoy Kevin | -- | First Source Title | |
| Harris Latalia N | $83,000 | Chicago Title | |
| Mullis Peggy | $77,000 | Chicago Title | |
| Rinehart Darci | -- | Connor Title Co | |
| Studabaker Julia A | -- | -- |
Source: Public Records
Mortgage History
| Date | Status | Borrower | Loan Amount |
|---|---|---|---|
| Open | Mccoy Kevin | $40,000 | |
| Previous Owner | Harris Latalia N | $80,500 | |
| Previous Owner | Mullis Peggy | $61,600 |
Source: Public Records
Tax History
| Year | Tax Paid | Tax Assessment Tax Assessment Total Assessment is a certain percentage of the fair market value that is determined by local assessors to be the total taxable value of land and additions on the property. | Land | Improvement |
|---|---|---|---|---|
| 2025 | $2,100 | $46,800 | $8,540 | $38,260 |
| 2024 | $2,100 | $46,800 | $8,540 | $38,260 |
| 2023 | $2,074 | $46,795 | $8,540 | $38,255 |
| 2022 | $1,318 | $25,410 | $5,180 | $20,230 |
| 2021 | $1,320 | $25,410 | $5,180 | $20,230 |
| 2020 | $1,322 | $25,410 | $5,180 | $20,230 |
| 2019 | $1,230 | $20,270 | $4,130 | $16,140 |
| 2018 | $1,252 | $20,270 | $4,130 | $16,140 |
| 2017 | $1,229 | $20,270 | $4,130 | $16,140 |
| 2016 | $1,408 | $21,250 | $3,890 | $17,360 |
| 2015 | $1,278 | $21,250 | $3,890 | $17,360 |
| 2014 | $1,281 | $21,250 | $3,890 | $17,360 |
| 2013 | $702 | $23,590 | $4,305 | $19,285 |
Source: Public Records
Map
Nearby Homes
- 2283 Ward Rd
- 2267 Ferris Rd
- 4090 Cleveland Ave
- 2100 Ferris Rd
- 2299 Belcher Dr
- 4123 Arbury Ln
- 2298 Belcher Dr
- 2045 Sale Rd
- 2023 Ferris Rd
- 2583 Milverton Way
- 2081 Ormond Ave
- 1997 Ferris Rd
- 1946 Lehner Rd
- 2010 Melrose Ave
- 1874 Sale Rd
- 1863 Ward Rd
- 2594 Adda Ave
- 1734 Ferris Rd
- 2618 Clybourne Rd
- 3689 Beacontree Dr
Your Personal Tour Guide
Ask me questions while you tour the home.