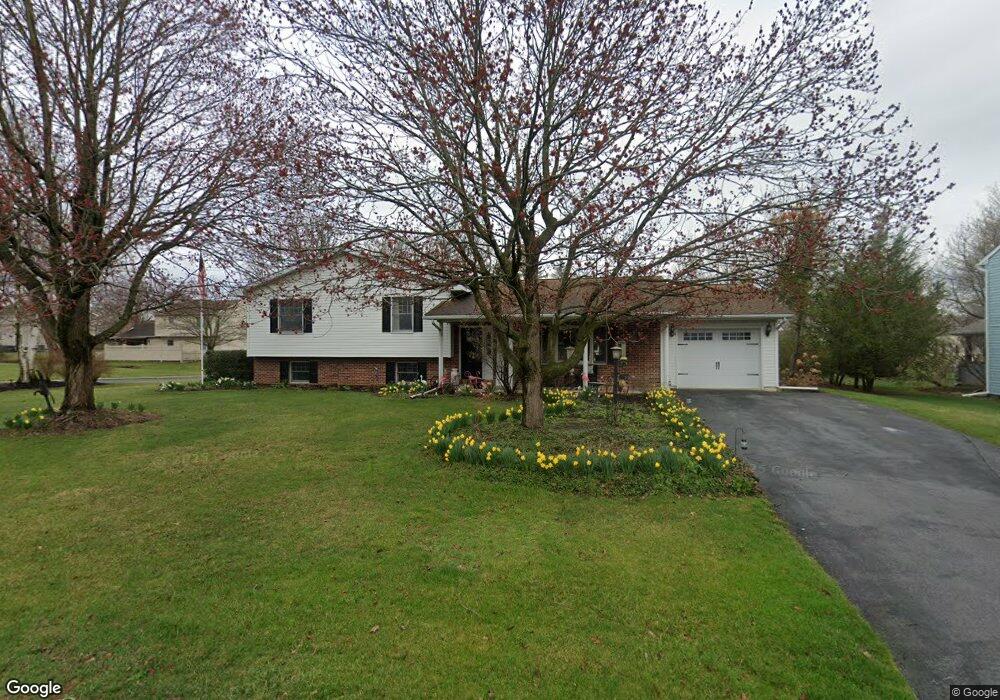
2299 Roylen Cir State College, PA 16801
Estimated Value: $391,000 - $417,000
4
Beds
3
Baths
2,695
Sq Ft
$150/Sq Ft
Est. Value
About This Home
This home is located at 2299 Roylen Cir, State College, PA 16801 and is currently estimated at $405,512, approximately $150 per square foot. 2299 Roylen Cir is a home located in Centre County with nearby schools including Ferguson Township Elementary School, Mount Nittany Middle School, and State College Area High School.
Ownership History
Date
Name
Owned For
Owner Type
Purchase Details
Closed on
Jul 29, 2009
Sold by
Lucchesi Scott and Faris Christopher
Bought by
Chandler Wade B and Chandler Anne V
Current Estimated Value
Home Financials for this Owner
Home Financials are based on the most recent Mortgage that was taken out on this home.
Original Mortgage
$210,000
Outstanding Balance
$138,726
Interest Rate
5.47%
Mortgage Type
Purchase Money Mortgage
Estimated Equity
$266,786
Purchase Details
Closed on
May 12, 2009
Sold by
Grp Loan Llc
Bought by
Lucchesi Scott and Faris Christopher
Purchase Details
Closed on
Apr 22, 2009
Sold by
Houck Patti and Houck Patte J
Bought by
Grp Loan Llc
Purchase Details
Closed on
Feb 8, 2006
Sold by
Arampatzis William F and Houck Patti J
Bought by
Houck Patti J
Home Financials for this Owner
Home Financials are based on the most recent Mortgage that was taken out on this home.
Original Mortgage
$165,000
Interest Rate
9.8%
Mortgage Type
New Conventional
Create a Home Valuation Report for This Property
The Home Valuation Report is an in-depth analysis detailing your home's value as well as a comparison with similar homes in the area
Home Values in the Area
Average Home Value in this Area
Purchase History
| Date | Buyer | Sale Price | Title Company |
|---|---|---|---|
| Chandler Wade B | $230,000 | None Available | |
| Lucchesi Scott | $162,000 | None Available | |
| Grp Loan Llc | $130,000 | None Available | |
| Houck Patti J | -- | None Available |
Source: Public Records
Mortgage History
| Date | Status | Borrower | Loan Amount |
|---|---|---|---|
| Open | Chandler Wade B | $210,000 | |
| Previous Owner | Houck Patti J | $165,000 |
Source: Public Records
Tax History Compared to Growth
Tax History
| Year | Tax Paid | Tax Assessment Tax Assessment Total Assessment is a certain percentage of the fair market value that is determined by local assessors to be the total taxable value of land and additions on the property. | Land | Improvement |
|---|---|---|---|---|
| 2025 | $3,884 | $62,715 | $17,095 | $45,620 |
| 2024 | $3,632 | $62,715 | $17,095 | $45,620 |
| 2023 | $3,632 | $62,715 | $17,095 | $45,620 |
| 2022 | $3,534 | $62,715 | $17,095 | $45,620 |
| 2021 | $3,534 | $62,715 | $17,095 | $45,620 |
| 2020 | $3,534 | $62,715 | $17,095 | $45,620 |
| 2019 | $2,947 | $62,715 | $17,095 | $45,620 |
| 2018 | $3,412 | $62,715 | $17,095 | $45,620 |
| 2017 | $3,370 | $62,715 | $17,095 | $45,620 |
| 2016 | -- | $62,715 | $17,095 | $45,620 |
| 2015 | -- | $62,715 | $17,095 | $45,620 |
| 2014 | -- | $62,715 | $17,095 | $45,620 |
Source: Public Records
Map
Nearby Homes
- 2311 Ridgeview Rd
- 114 Gala Dr Unit 114
- 2330 W Whitehall Rd
- 114 Apple View Dr
- 131 Apple View Dr
- 142 Apple View Dr
- Bayberry Plan at Orchard View
- Charlotte Plan at Orchard View
- Aspen Plan at Orchard View
- Chamberlain Plan at Orchard View
- Greenwood Plan at Orchard View
- Wyndham Plan at Orchard View
- Monroe Plan at Orchard View
- Newport Plan at Orchard View
- Dartmouth Plan at Orchard View
- 179 Apple View Dr
- 178 Apple View Dr
- 511 Hawknest Rd
- 3416 W College Ave
- 3291 Shellers Bend Unit 702
- 2293 Roylen Cir
- 2298 Bristol Ave
- 2301 Abington Cir
- 2294 Bristol Ave
- 2296 Roylen Cir
- 2306 Bristol Ave
- 2298 Roylen Cir
- 2287 Roylen Cir
- 2294 Roylen Cir
- 2306 Abington Cir
- 2288 Bristol Ave
- 2288 Roylen Cir
- 2309 Abington Cir
- 2299 Bristol Ave
- 2285 Roylen Cir
- 2308 Abington Cir
- 2305 Bristol Ave
- 2286 Roylen Cir
- 2286 Bristol Ave
- 2293 Bristol Ave